Satellites are the weather eyes in the sky that meteorologists use to see major rainand snow storms, thunderstorms ahead of warm fronts or along cold fronts, high clouds andfog, and even jet stream winds.
These images come in a variety of forms and sizes, from global composites that resemblesnapshots of the Earth from space to tight close ups of individual thunderstorm tops, dayor night. But, in one form or another, all images show the same thing – water as clouds orvapor in the atmosphere.
By the way, "images" is a much better word than "photo" to describethe pictures from satellites because they show things no ordinary camera could evercapture, such as invisible water vapor or the temperatures of cloud tops.
When meteorologists saw the first images of Earth from NASA’s Tiros 1 spacecraft in1960, they quickly realized that satellites would play a vital role in understanding andforecasting weather. More than three decades of fine tuning have sharpened the resolutionof these images. Today’s sensors can capture details as small as one-half mile across, andtechnological advances have increased the number of ways of probing the lower atmosphere.
Satellite sensors detect and record the radiation reflected and radiated by clouds andwater vapor in the troposphere. Radiation sensed in the visible part of the spectrum(ordinary light) allows satellites to reproduce the Earth’s cloud cover as if they weretaking a picture of Earth from space. Infrared radiation emitted by clouds reveals theirtemperatures, which can then be used to calculate cloud heights.
The National Oceanic and Atmospheric Administration uses two kinds of satellites:
Geostationary Operational Environmental Satellites (GOES) orbit the Earth from a position 22,380 miles above the equator. At this position they orbit at the same speed that the Earth turns, so they remain over the exact same spot on the equator – hence, the name geostationary – and scan the same geographic area all the time. The images you see on TV weathercasts or the Internet are almost always from GOES.
Polar Orbiter Environmental Satellites (POES) circumnavigate the Earth nearly across its poles. Cruising at altitudes of 300 to 500 miles, POES can reveal details about cloud cover and water vapor in higher latitudes, where GOES images are usually distorted because of Earth’s curvature. As the Earth revolves beneath their orbit, these satellites scan a new 900-mile-wide strip of land and ocean and the atmosphere above them on each pass.
Figure 1 — Visible images depict cloud cover by measuring the amount of solar radiation the clouds reflect. As the table below shows, thick clouds and fresh snow reflect more light than thin clouds, so they appear brighter in the images. Thin clouds appear gray, and areas with no shading are generally clear.
| ||||||||||||
Scientists and forecasters make mini movies using consecutive GOES images, looping themto see a storm’s motion during the previous hours and days. The U.S. operates twogeostationary satellites, GOES 8 covers the eastern U.S. and Atlantic, GOES 9 the West andpart of the Pacific. The Europeans and Japanese operate similar satellites that cover mostof the rest of the world.
The close imaging from POES and the lack of easily accessible images mean they are notvery useful to pilots. We’ll focus on GOES imagery because it’s easier to understand andis much easier to find.
Visible Images
The image in Figure 1 is a visible GOES image. You can use such images as if they werephotographs. Visible images depict cloud cover by measuring the amount of solar radiationthe clouds reflect. As Table 1 shows, thick clouds and fresh snow reflect more light thanthin clouds and appear brighter in the images. Thin clouds appear gray and areas with noshading are generally clear.
But, there’s some danger in relying upon visible images alone to determine cloud cover.Because low, middle, and high clouds reflect about the same amount of sunlight, a visibleimage can be misleading, often not telling pilots anything about cloud heights. Areas thatappear clear on a visible image might be covered by a thin veil of clouds or fog thatcould obstruct your view of an airport, making a VFR landing impossible. To get a truerreading of clouds, you should also look at infrared images.
Infrared Scans
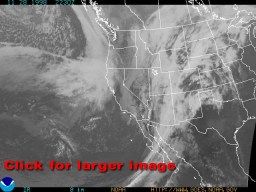 Figure 2 — Satellites that scan the infrared (IR) wavelength measure cloud top temperatures rather than reflected light. In this image, the highest clouds (with the coldest tops) appear bright white. Middle clouds have warmertops and appear in shades of gray. Low clouds and fog show up as the darkest shades of gray in this IR image. |
Satellites that scan the infrared (IR) wavelength actually measure cloud toptemperatures rather than reflected light, as in visible satellite images. Becausetemperatures in the lower part of the atmosphere decrease with increasing altitude,high-level clouds are cooler than low-level clouds. Low-top clouds with warmertemperatures appear darker in IR images than taller, colder cloud tops.
In Figure 2, the highest clouds, probably cirrus, off the mid-Atlantic and New Englandcoasts appear bright white. Middle clouds over the central U.S. have warmer cloud tops andappear in shades of gray. Low clouds and fog show up as the darkest shades of gray in thisIR image, such as over east Texas and Louisiana.
One obvious advantage pilots have when viewing visible and infrared images together isthat dangerous thunderstorms are very apparent. In both Figures 1 and 2, you can seethunderstorms north of the Bahamas and east of Florida. Cumulonimbus (thunderstorm) cloudsare always thick, and usually are the tallest clouds. They reflect a lot of sunlight, andtheir cirrus anvils are very cold. Thunderstorms show up as bright white clusters in bothvisible and IR satellite images.
Another obvious advantage of IR images is that they are available at night, whilevisible images are only useful during daylight hours. But pilots need to be careful whenusing satellites to identify areas of low clouds and fog, especially at night.
Because low clouds and fog are often the same temperature as the ground, an IR imagemight show both as dark gray, not distinguishing between the clouds or fog and the ground.A visible image during daylight should reveal the low clouds and fog. At night, you shouldcheck weather observations and pilot reports for fog or low clouds.
Jet streams are rivers of upper-air winds that pilots of high-flying planes can use totheir advantage when flying from west to east, or that they would want to avoid whenflying east to west. Jet streams are not very obvious on either visible or IR images. Thisis where satellites’ special water vapor imaging is useful.
Water Vapor Channel
 Figure 3 — This is a water vapor image. It shows humid air feeding into an immense storm over the Pacific Northwest. Dry air is indicated by the black areas, and areas of moderate moisture appear as intermediate shades of gray. |
Today’s satellites offer a third type of imagery. They can sense and measure humid airusing part of the IR scanning range called the "vapor channel." Vapor channelimages show water vapor as shades of gray to white – the whiter the shade, the more humidthe air. Dark shades of gray indicate drier air, with black shading for very dry air. GOESwater vapor imagery can be animated to reveal the swirling motions of middle and upperlevel winds as they move the water vapor around.
Upper-air jet streams, which often transport high-level moist air, are readily visibleon water vapor images, as are mid-level storms. Such mid-level storms, or upper airdisturbances, can often create clouds and precipitation in areas with no surface stormsaround. They can also help trigger surface storms.
Figure 3 is a water vapor image. It shows humid air feeding into the southern end of animmense storm over the Midwest. Dry air is wrapping into the back side of the same stormas indicated by the black areas penetrating the storm’s center from the west. A streak oflight gray across the bottom of the figure shows the subtropical jet stream racing fromwest to east and energizing thunderstorms over the Gulf of Mexico. A faint swirl in thewater vapor over Utah indicates a mid-level storm, which is probably bringing rain andsnow to the Rockies.
Don’t expect any kind of satellite image to give you all the information you need for asafe flight. Even forecasters who are expert in reading satellite images use them inconjunction with other information to make predictions. Still, satellites with their viewof weather from much higher than any airplane can fly, can help you understand the bigpicture of what the atmosphere is doing as you prepare to fly.
Internet Satellites
Because the National Oceanic and Atmospheric Administration (NOAA) is the main user of satellite data, its Geostationary Satellite Browse Server (http://www.goes.noaa.gov) is the one stop for the latest visible, IR and water vapor images for the U.S. The Cooperative Institute for Research in the Atmosphere current weather page has links to visible, IR (long wave) and water vapor images for the eastern half of the U.S. (GOES-8) and the western half of the U.S. (GOES-9) at http://www.cira.colostate.edu/Special/CurrWx/currwx.htm. NOAA’s Aviation Weather Center has lots of products for pilots. Its main page has links to eastern and western U.S. visible satellite images at http://www.awc-kc.noaa.gov/awc/aviation_weather_center.html. The University of Wisconsin-Madison’s Space Science and Engineering Center has links to a variety of visible, IR and water vapor images of the U.S. and the Western Hemisphere at http://www.ssec.wisc.edu/data/. The NOAA National Environmental Satellite Data and Information Service (NEDIS) Forecast Products Development Team enhances satellite imagery to create special products such as winds in the atmosphere, nighttime low cloud and fog images, and experimental aircraft icing products. You’ll find this at http://ns.noaa.gov/NESDIS/NESDIS_Home.html. |