On Saturday afternoon, I was grinding away on the cross trainer at my local gym watching CNN try cover the Asiana crash at San Francisco. I say “try” because reporters with absolutely no meaningful information were attempting to fill air time. Nothing new about that. For the hour or so that I watched the coverage, it had fewer inanities than I’d have expected.
But I was also wondering how long it would take the networks to figure out what the real story was and that’s this: We don’t see this sort of thing very often. Even those of us involved in aviation lose track of overall accident trends. While I was pedaling, I was searching my mental database for the last time there was a hull-loss accident involving fatalities for Part 121 carriers in the U.S. All I could come up with was the Colgan crash in Buffalo in February of 2009. When I got home and swept the NTSB database, I found I was right. That’s almost five years without a major airline accident and if that’s not shocking, it’s at least impressive. And before that, it was the Lexington, Kentucky Comair crash. Guess when that was? It was 2006, seven years ago next month.
You’ll occasionally hear safety experts argue that the airline accident rate could still be improved, but it’s difficult to see how, given the nature of random chance and that humans, by and large, still operate the entire man-machine interface. The fatal accident rate for the scheduled airlines has been effectively zero since 2010 and even the Colgan crash barely nudged the needle off the peg. The overall accident rate for the airlines-and that includes everything from the catering truck bashing a door to runway departures from contaminated runways-stands at about 0.162/100,000 hours. To put that in context, the general aviation rate, at 6.3, is 39 times higher.
And we all know how this has been achieved and maintained. There’s no silver bullet, but a combination of better equipment and engines, safety trend monitoring and information exchange, improved training and refined cockpit procedures. Even knowing all of that, the sheer numbers involved are astounding. In the U.S., there are about 10 million scheduled flights per year or 27,000 a day, give or take. So out of all those takeoffs and landings, you’d figure that in at least one or two a year, someone would get slow on final, lose it in a crosswind or just otherwise really prang one and tear up an airplane. That does happen, but it so rarely involves fatalities that it’s not too much of an exaggeration to say the airline industry has managed to squeeze random chance out of its operations, a fact that makes the Asiana crash seem all the more rare, which it in fact, is.
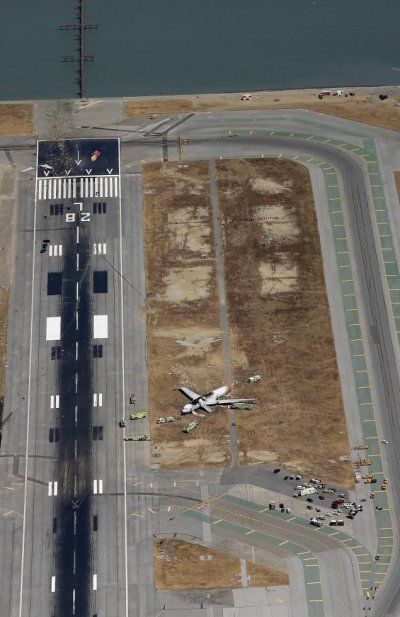
As the Sunday news cycle spun up, the inevitable speculation began and while I’m not interested in joining it, I did find one remarkable picture of the accident which shows the what if not the why. It’s an aerial photo looking back from the departure end of runway 28L toward the approach end. None of the dozens of other photos and frame grabs I saw show what this one does.
Specifically, the airplane came to a stop in about 1500 feet. Note that in the photo, the wreckage is abeam the first fixed-distance marker just past the aiming point markers. You can see the broken off horizontal and vertical fins just shy of the threshold. So what’s the approach speed for a 777-maybe 140 knots indicated or so at a post-oceanic flight landing weight? That’s a lot of energy dissipation in a short distance, suggesting a very violent ride and probably laudable crashworthiness, too, considering there were only two fatalities. Despite the ugly outcome and even the fire, modern air transports can clearly take a beating and still remain survivablely intact and passengers, thanks to trained crew, can get out of them in a hurry. To me, that’s as impressive as the aforementioned accident rates. Let’s hope that finds its way into the news stories, too.


