


")

")


Watching the continuous streaming of a waterfall can be mesmerizing. Something inside all of us expects it to have a beginning or end, so we watch and wait, and eventually we just let it go—realizing that it will continue falling down in that place, sometimes for centuries.
The wind is like that too, but we can’t really see it. We can see its effects on trees, flags, and grass, but not the actual swirling of gentle breezes or the flooding of a wintry blast from the arctic. Unlike a waterfall it does not stay confined to a single pathway but rides haphazardly across the terrain.
Forecasting Winds
The National Weather Service cannot bridle the winds and turn them to humanity’s advantage. The most they can do is attempt to predict the general direction and speed winds will take over a given geographic point. Every day, at specific times, hundreds of high-altitude weather balloons are released with instrument packages to record wind direction, speeds and air temperatures as they rise.
The data from those is combined with reports from aircraft aloft to create a forecast, which can offer pilots a mental picture of what they’ll encounter as they transit the sky. Having pilots at all altitudes relay wind data in pilot reports is crucial to the ability of the NWS to predict and monitor wind flow and the movement of large air masses.
The NWS offers this data both in textual and graphical format broken down by altitude. The format of the wind forecast text was created to minimize the sheer volume of data being sent at a time before there were gigabit streams available. This is why traditionally the winds were reported or forecast every 3000 feet from the surface to 12,000 feet, and above that altitude every 6000 feet. Pilots flying between these altitudes were expected to interpret what their winds should be based on that data.
The data block would show only four numbers for wind direction and speed. The first two numbers indicated the compass direction — which is normally three digits but the last is assumed to be a zero — and dropped from the data. The last two numbers are wind speed.
So a wind speed of 1210 would be interpreted as 120 degrees at 10 knots. Whenever the wind speed topped 100 knots, as is frequent at jet stream levels, the NWS added 50 to the direction and subtracted a hundred from the speed. 7306 would be interpreted as 230 degrees at 106 knots. Fortunately, the computer systems of today can write out 230106, which is a lot less confusing to those who are self-briefing.

Even better is a picture. The graphic shows arrows that are pointed in the direction of wind flow with tails that indicate speed: the denser the tails, the faster the wind. One line, or tick, is 10 knots, a flag is fifty knots. Over Pueblo, Colorado (enlarged excerpt) you see an indicator with a flag and a half-tick indicating the wind is out of the west at about 55 knots.
The www.aviationweather.gov site allows you to view graphics such as this one at specific altitudes from 3000 feet to 53,000 feet. By clicking between altitudes you can get a feel if going a little higher or lower would impact your groundspeed to help save time and fuel.
Velocity Azimuth Display
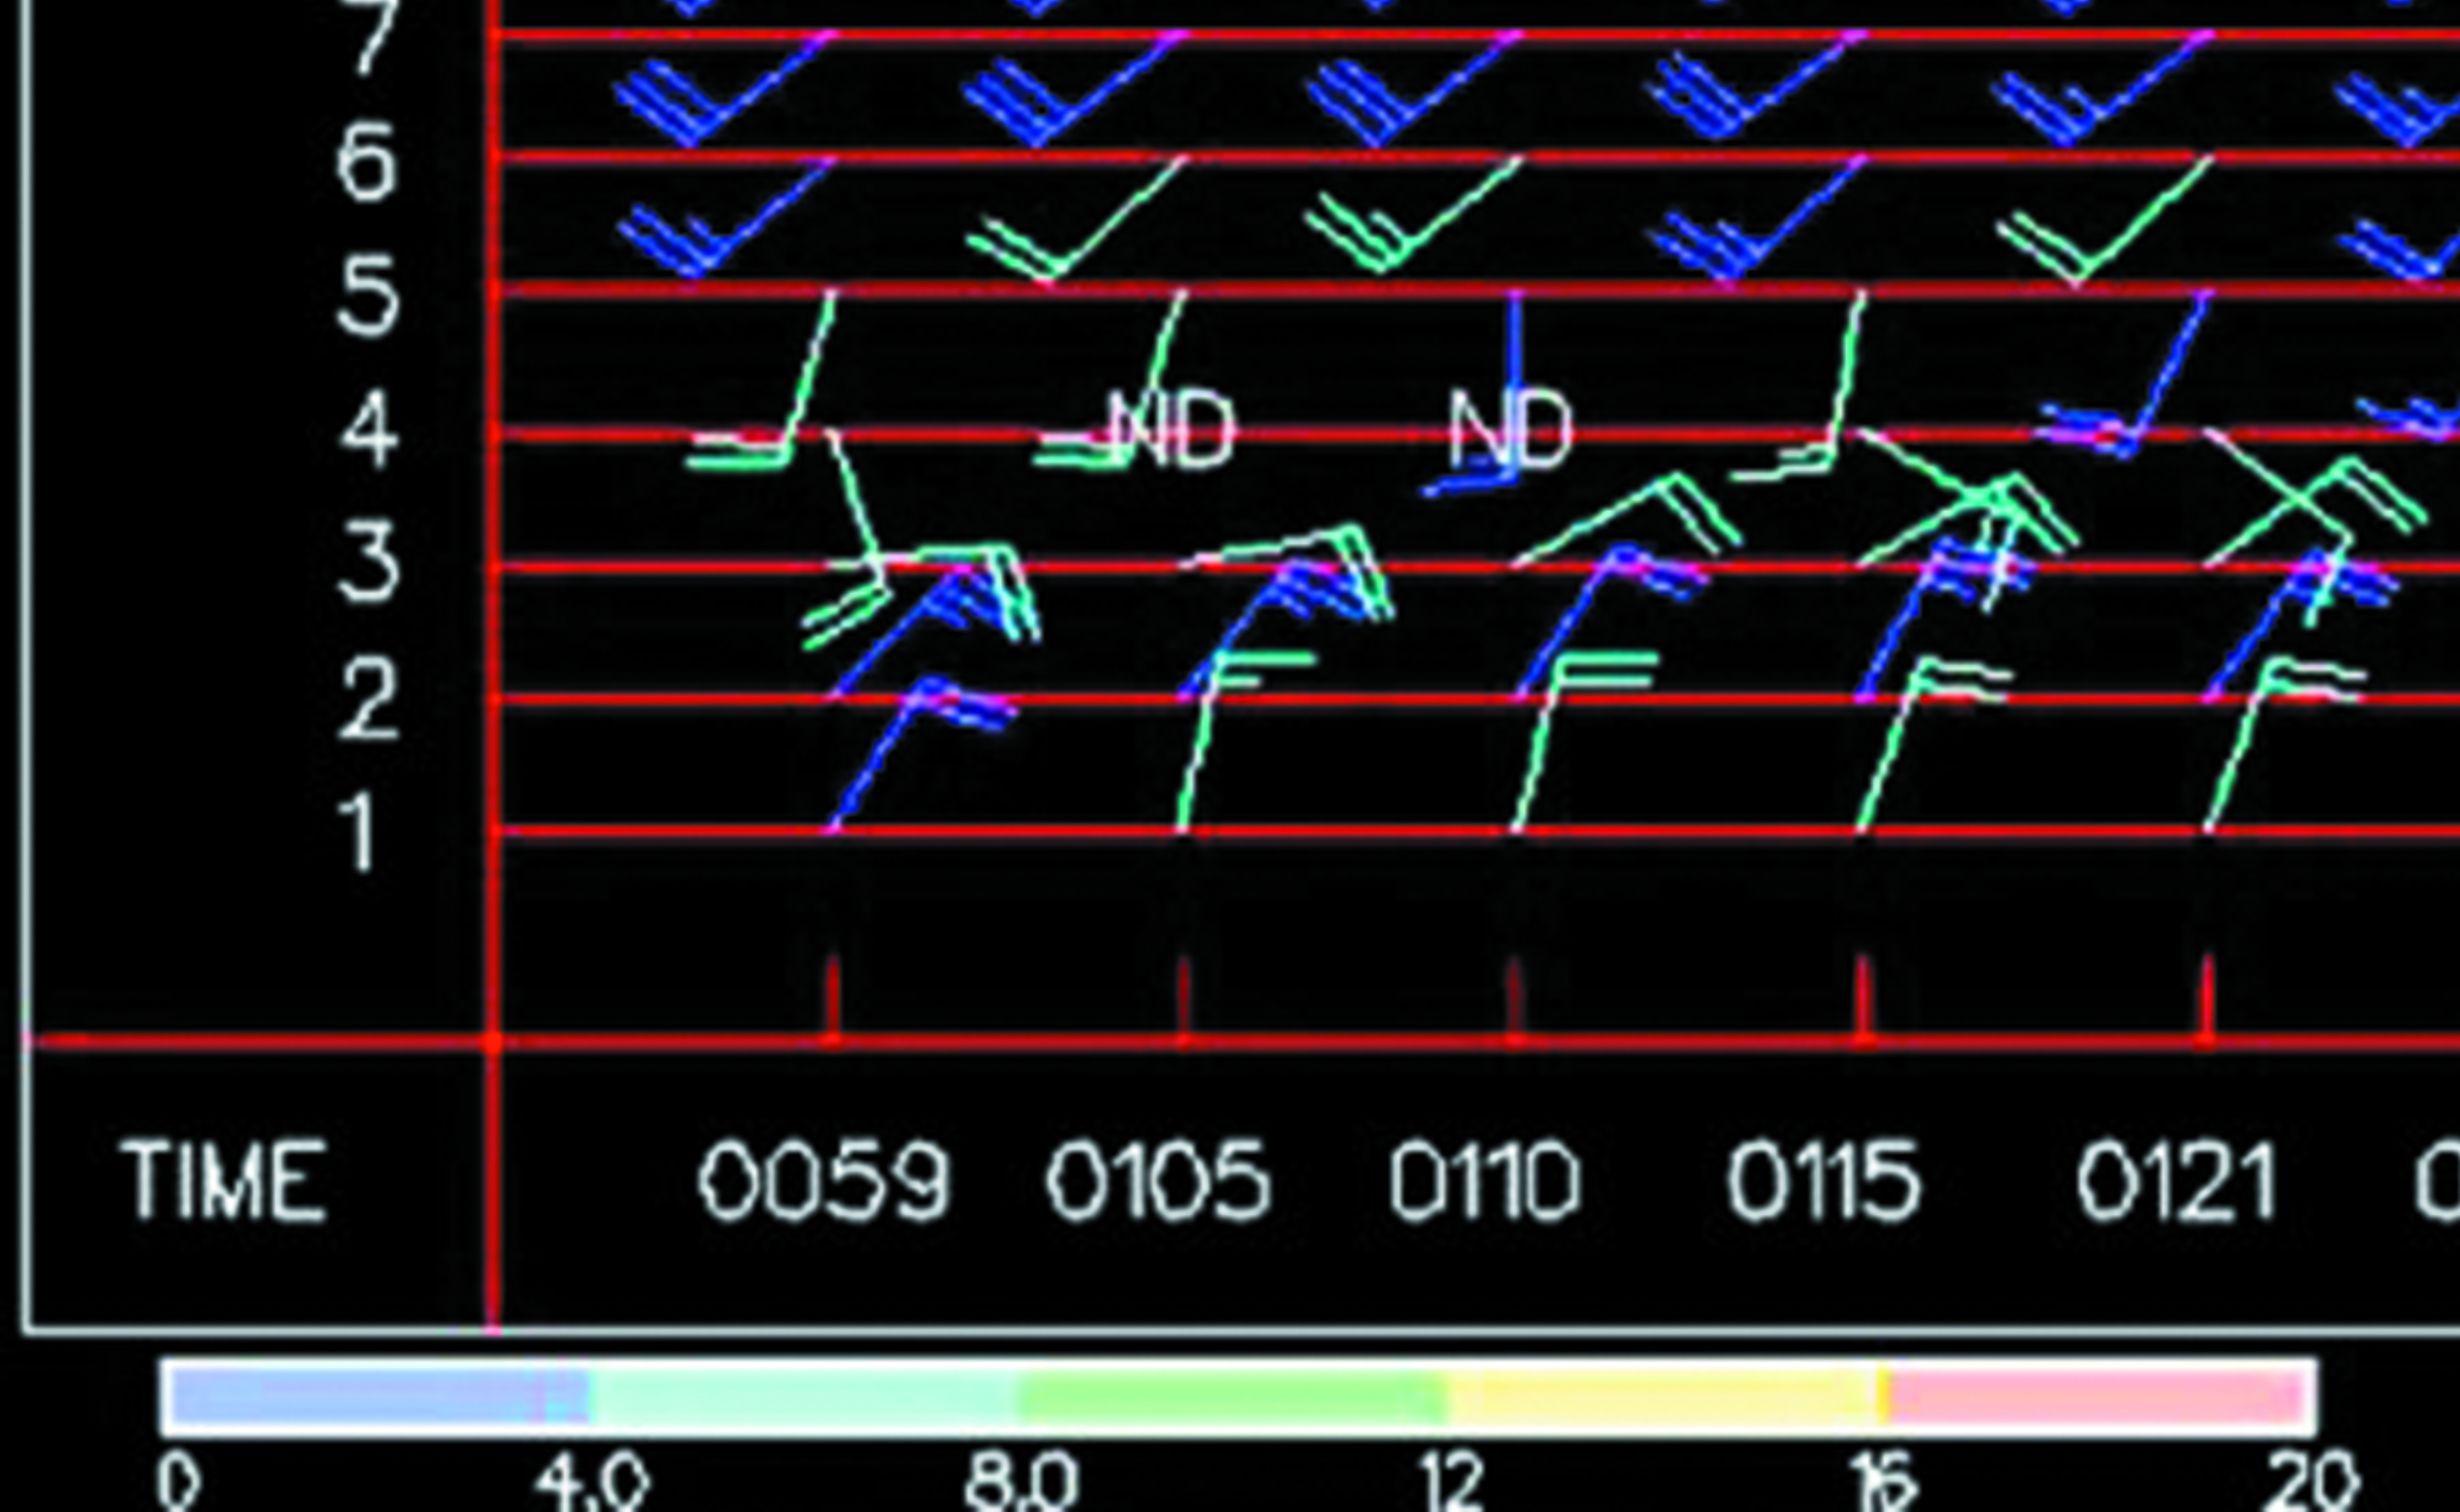
Some types of flight, such as low level air racing teams and balloonists, want more altitude specific wind flow reports. The VAD (Velocity Azimuth Display) is a graph showing the direction and speed of winds recorded above a single radar site. The site picks up on minute particles of dust or precipitation flowing through its beam and displays the data for each one thousand feet on radar.
The depicted VAD is from the Chicago radar. Each horizontal line is 1000 feet of elevation. The numbers at the bottom are the GMT times of each sweep—in this case every six minutes. The ND at the upper altitudes indicate No Data was received for that altitude at that time.
Note how the winds are shifting in Chicago. At 1000 feet they are out of the north-northeast at 15 to 20 knots. By 3000 feet they have shifted significantly to an easterly flow and by 5000 feet they are out of the south.
The winds stabilize at 6000 feet and are primarily southwesterly over that point up through the thirty thousands. Checking other radar sites in the region you could tell if it’s a local phenomenon, or if those flow patterns hold true. Many times this data is crucial to balloon pilots or air racers.
One time I was working a briefing hotline for the International Gas balloon race. The flotilla of balloons had left Albuquerque in the early evening and most of them were headed northeasterly towards the Texas panhandle. Later afternoon storms were diminishing but present and the balloonists were calling to find what altitudes would best steer them around the activity. (Balloons and lightening are bad companions).
I used the VAD wind readouts off the Amarillo and Tucumcari radar sites combined with the radar mosaics for that area to advise them of the best altitudes. It worked and they were able to continue in their race to achieve the greatest distance from their departure point.
Wind flow patterns aloft draw a picture of how the Jet Stream is pulling major weather systems. A wildly waving pattern is prevalent in spring and fall as the planet’s axis is neutral to the sun. In summer and mid-winter when the sun is closest to one pole or another, the middle regions of the planet don’t get as much thermal stimulation in the upper atmosphere.
During the winter in the northern hemisphere when the sun is striking the ground further south, the air is warmer and rising upwards then expanding. This creates a vacuum closer to the ground levels and the heavy cold air from the North Pole wants to push southward to fill it. The Jet Stream drags all those layers of atmosphere below it eastwards across most of North America.
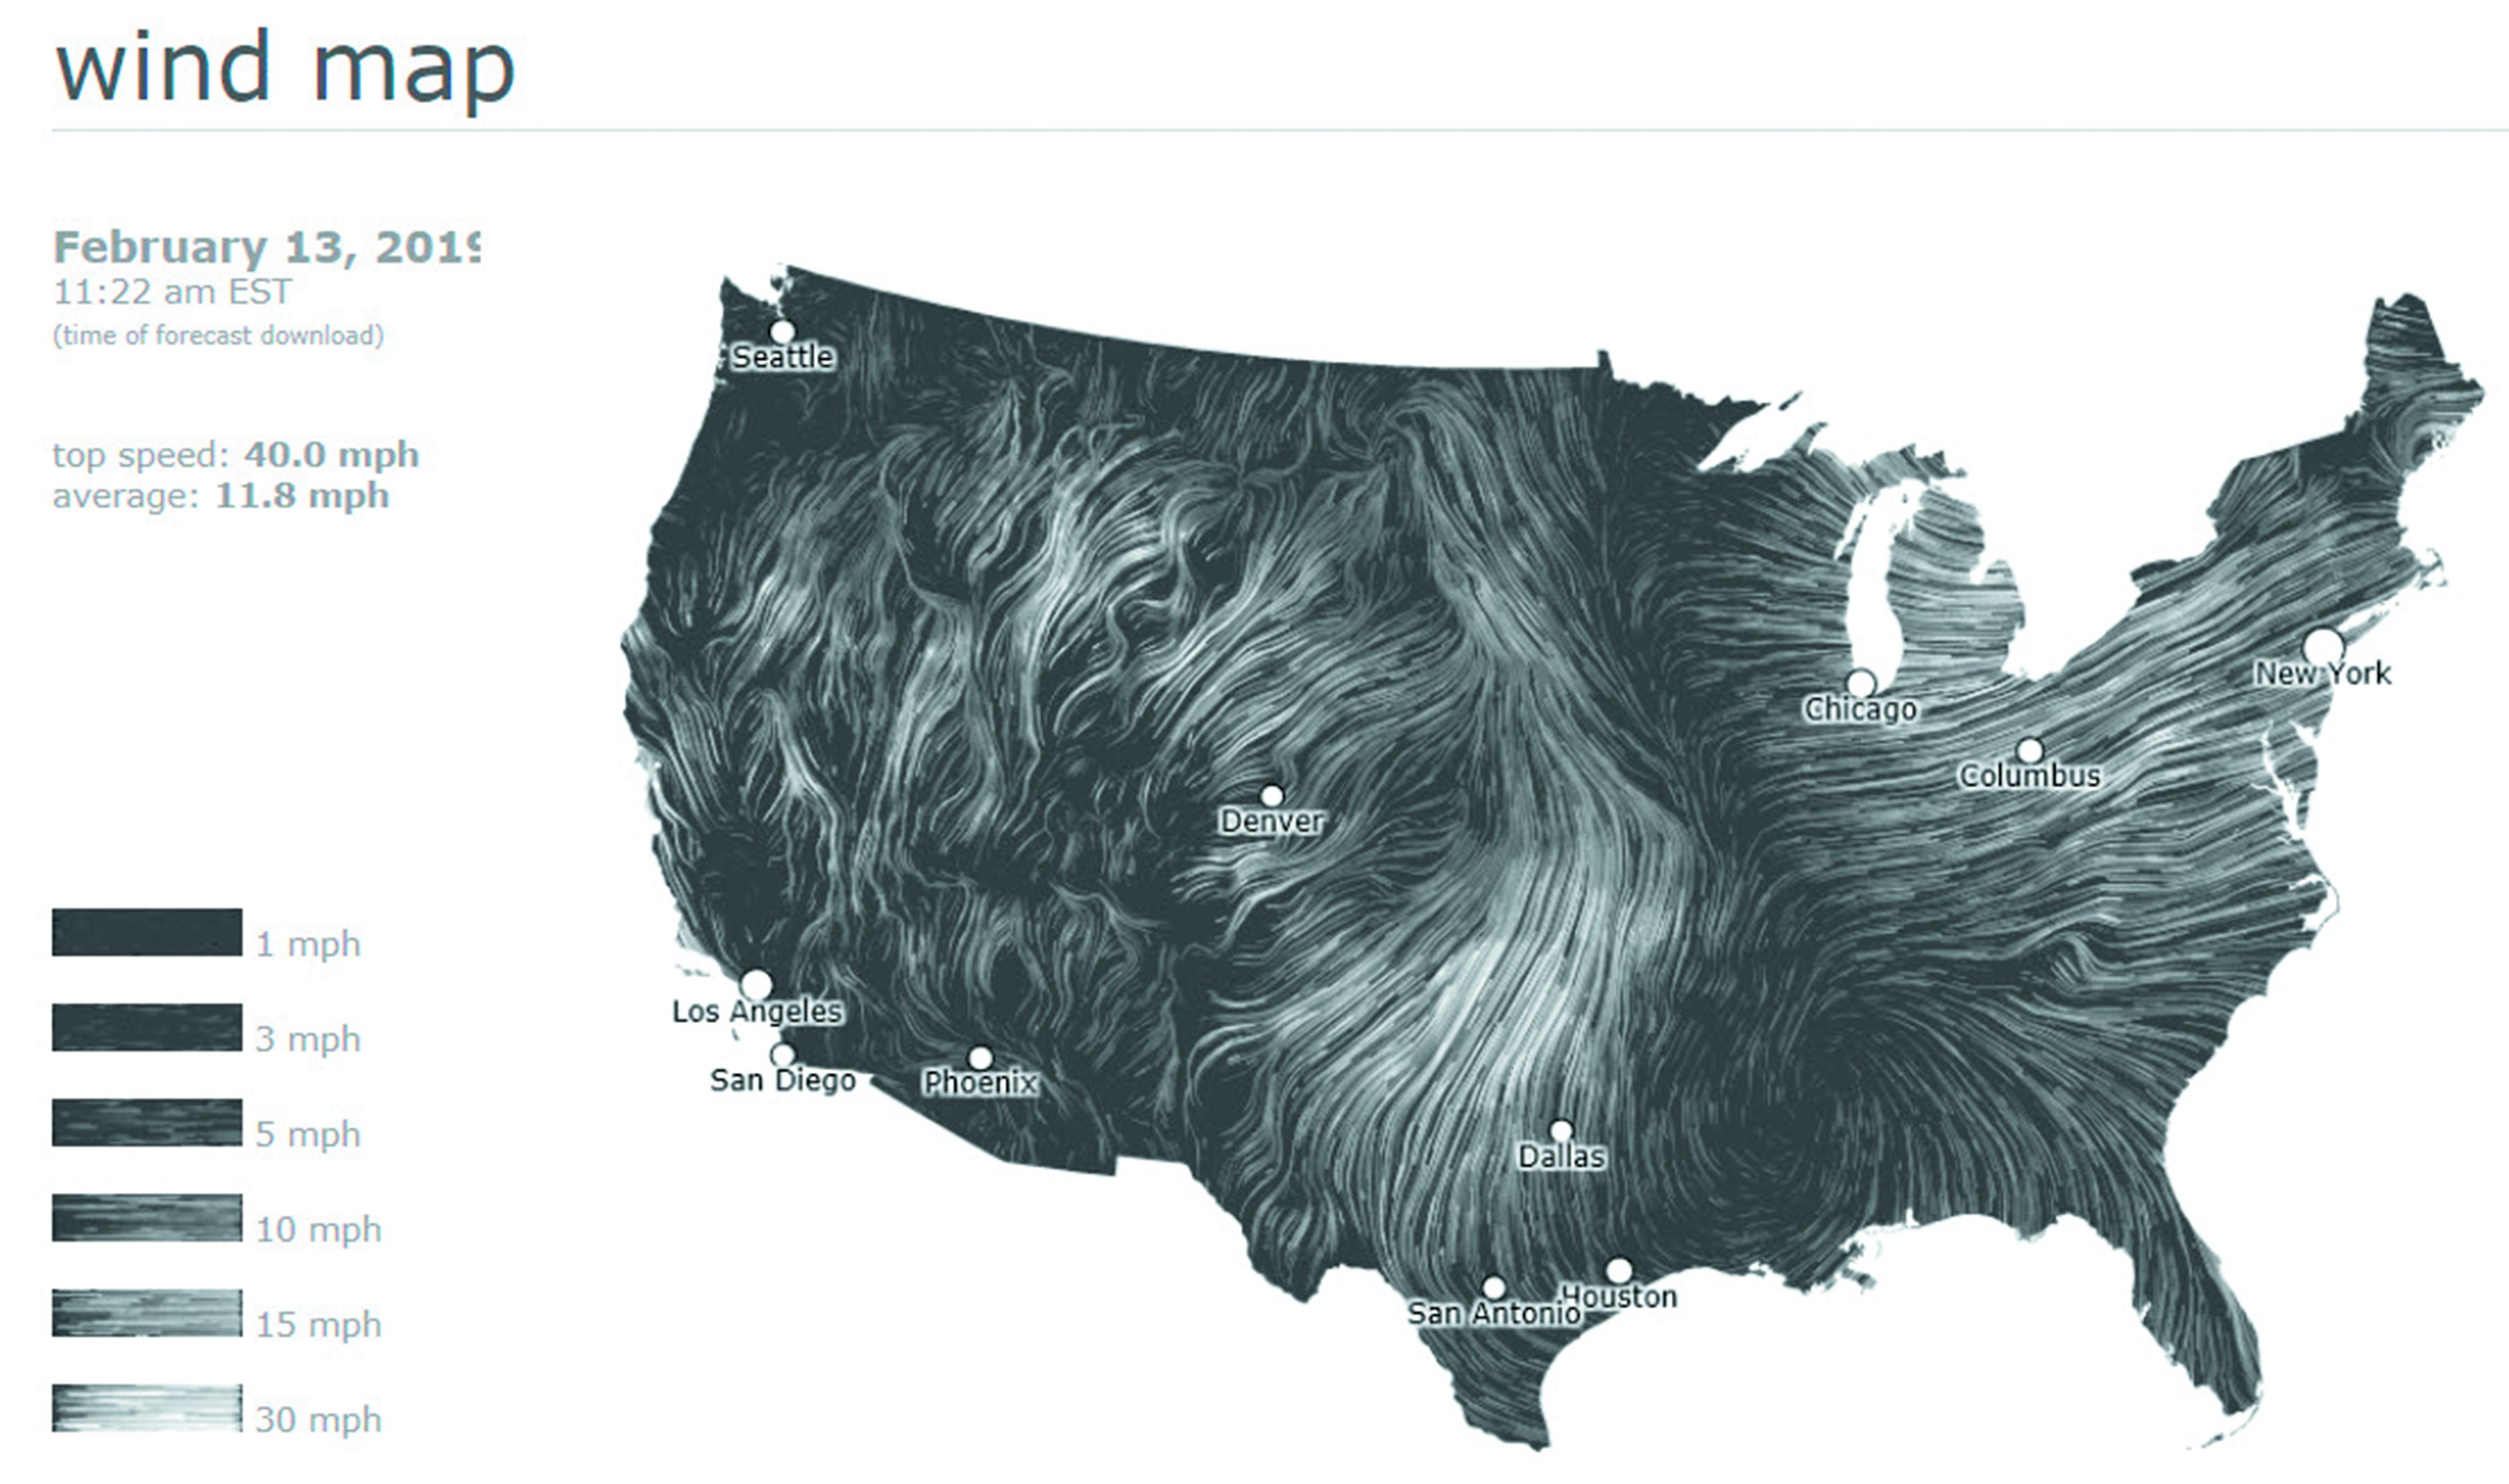
Finally, a recent real-time animation of the current surface wind pattern over the U.S. can be found at http://hint.fm/wind. Notable historical wind patterns are also available to aide in your understanding of significant storm patterns.
Rose Marie Kern received her Aviation Weather Forecasting certification from the National Weather Service in 1998 as a Flight Watch specialist. This incited a lifelong fascination for the study of weather and its effects on our flying environment. For more information go to her website: www.rosemariekern.com.
This article originally appeared in the April 2019 issue of IFR Refresher magazine.
For more great content like this, subscribe to IFR Refresher!

Check out https://www.windy.com
Great graphical depiction of surface wind conditions worldwide.