When the jet age arrived in 1959, little was known about wind shear. Aviation was focused on thunderstorm avoidance. In Joseph George’s compilation of Eastern Air Line’s forecasting techniques from that era, we find thunderstorms described in terms of turbulence, icing, and hail hazards. As jet aircraft were equipped with radar, it was assumed that the captain had all the tools needed to avoid weather. No attention was paid to wind shear, but awareness began ramping up.
Wind Shear “Discovered”
Crashes related to thunderstorms were beginning to appear in newspapers. Prominent examples were the 1953 BOAC Comet breakup near Calcutta, the Braniff BAC-111 crash in 1966, the loss of a Braniff Electra in Texas in 1968, and the 1963 Northwest Orient Boeing 720 crash in Florida. All were ascribed to powerful air currents in the storm and encounters with extreme turbulence.
If anything, it proved that aviation thunderstorm dangers were well entrenched in the public mind. Whatever the case, thunderstorm avoidance and onboard radar techniques continued to be emphasized, yet dangerous wind shear didn’t receive much recognition.
The International Civil Aviation Organization made the first calls for investigation of low-level wind shear in 1964. Early work was done throughout the 1960s to define the phenomena and identify locations where it was likely to exist. Its impact on aviation was not yet clear, but with computerized autoland systems entering production, authorities felt we needed to start figuring it out.
The impact on flight operations wasn’t fully appreciated until a series of accidents in the 1970s. In December 1973, an Iberia DC-10 descended below glideslope and struck the runway lights at Boston Logan Airport, while landing in a thunderstorm. This was seen as just another thunderstorm accident, but the accident report named wind shear specifically as a contributing factor.
The next month, a Pan Am 707 crashed at Pago Pago, killing 96. This should have sent a strong message about wind shear, but the message was muddled by other factors. The flight crew was disorientated by a night landing in rough weather, and failed to adhere to the approach procedure. But the NTSB studied the data and cited “excessive descent rate which developed as a result of the aircraft’s penetration through destabilizing wind changes.” Although wind shear was finally becoming recognized, many questions remained about its nature, and little was understood about the patterns that caused its development.
Turning Point
In June 1975, headlines broke with yet another air crash. Eastern Flight 66, a Boeing 727, went down in a rainstorm at New York JFK airport, killing 113. The flight, originating from New Orleans, went down on the approach lights and burned in an open area short of the threshold. There was a thunderstorm at the time, and a witness claimed seeing lightning striking the plane.
This was noteworthy for a couple reasons, besides making the evening news. The accident involved a large aircraft and a major U.S. airline, and it took place at a major U.S. airport. And since it was seemingly just a typical summer storm, a trained crew should have been capable of landing the airplane. The 54-year-old captain had over 17,000 flight hours in his log, while the 34-year-old first officer had amassed 5,000 hours.
In its investigation, the NTSB demonstrated the aircraft was brought down by a rapid change from a headwind, producing lift, to a tailwind, destroying it. Summarizing, it said, “close examination of the wind model disclosed transient periods in which the combination of downdraft speed and the rate-of-airspeed change might have exceeded the aircraft’s static performance capability”.
It was noted that aircraft preceding Eastern 66 encountered no bad conditions, while others reported trouble and having to go around. The extreme variability in the reports suggested the wind shear acted through small scales of time and space. But a pattern emerged. This captured the attention of a prominent tornado researcher.
Dr. Ted Investigates
Dr. Theodore “Ted” Fujita was a 55-year old meteorologist at the University of Chicago, known for his detailed study of a violent June 1957 tornado in Fargo, North Dakota. Fujita expertly used photogrammetry to develop the first scientific model of a tornadic storm. He also created the Fujita tornado scale in 1971 and saw weather systems as tightly related, with circulations on a continuous spectrum of time and space scales.
Fujita became known for data assimilation. He would use small bits of weather data to assemble a vast picture of the whole. He had just completed a study of the April 1974 Tornado Superoutbreak in the Ohio Valley, in which aerial photos found small-scale swirls of damage measuring no more than dozens of meters in scale, as well as divergence patterns around some of the wind damage. This divergence was similar to the scale of the tornado but showed none of the expected cyclonic rotation.
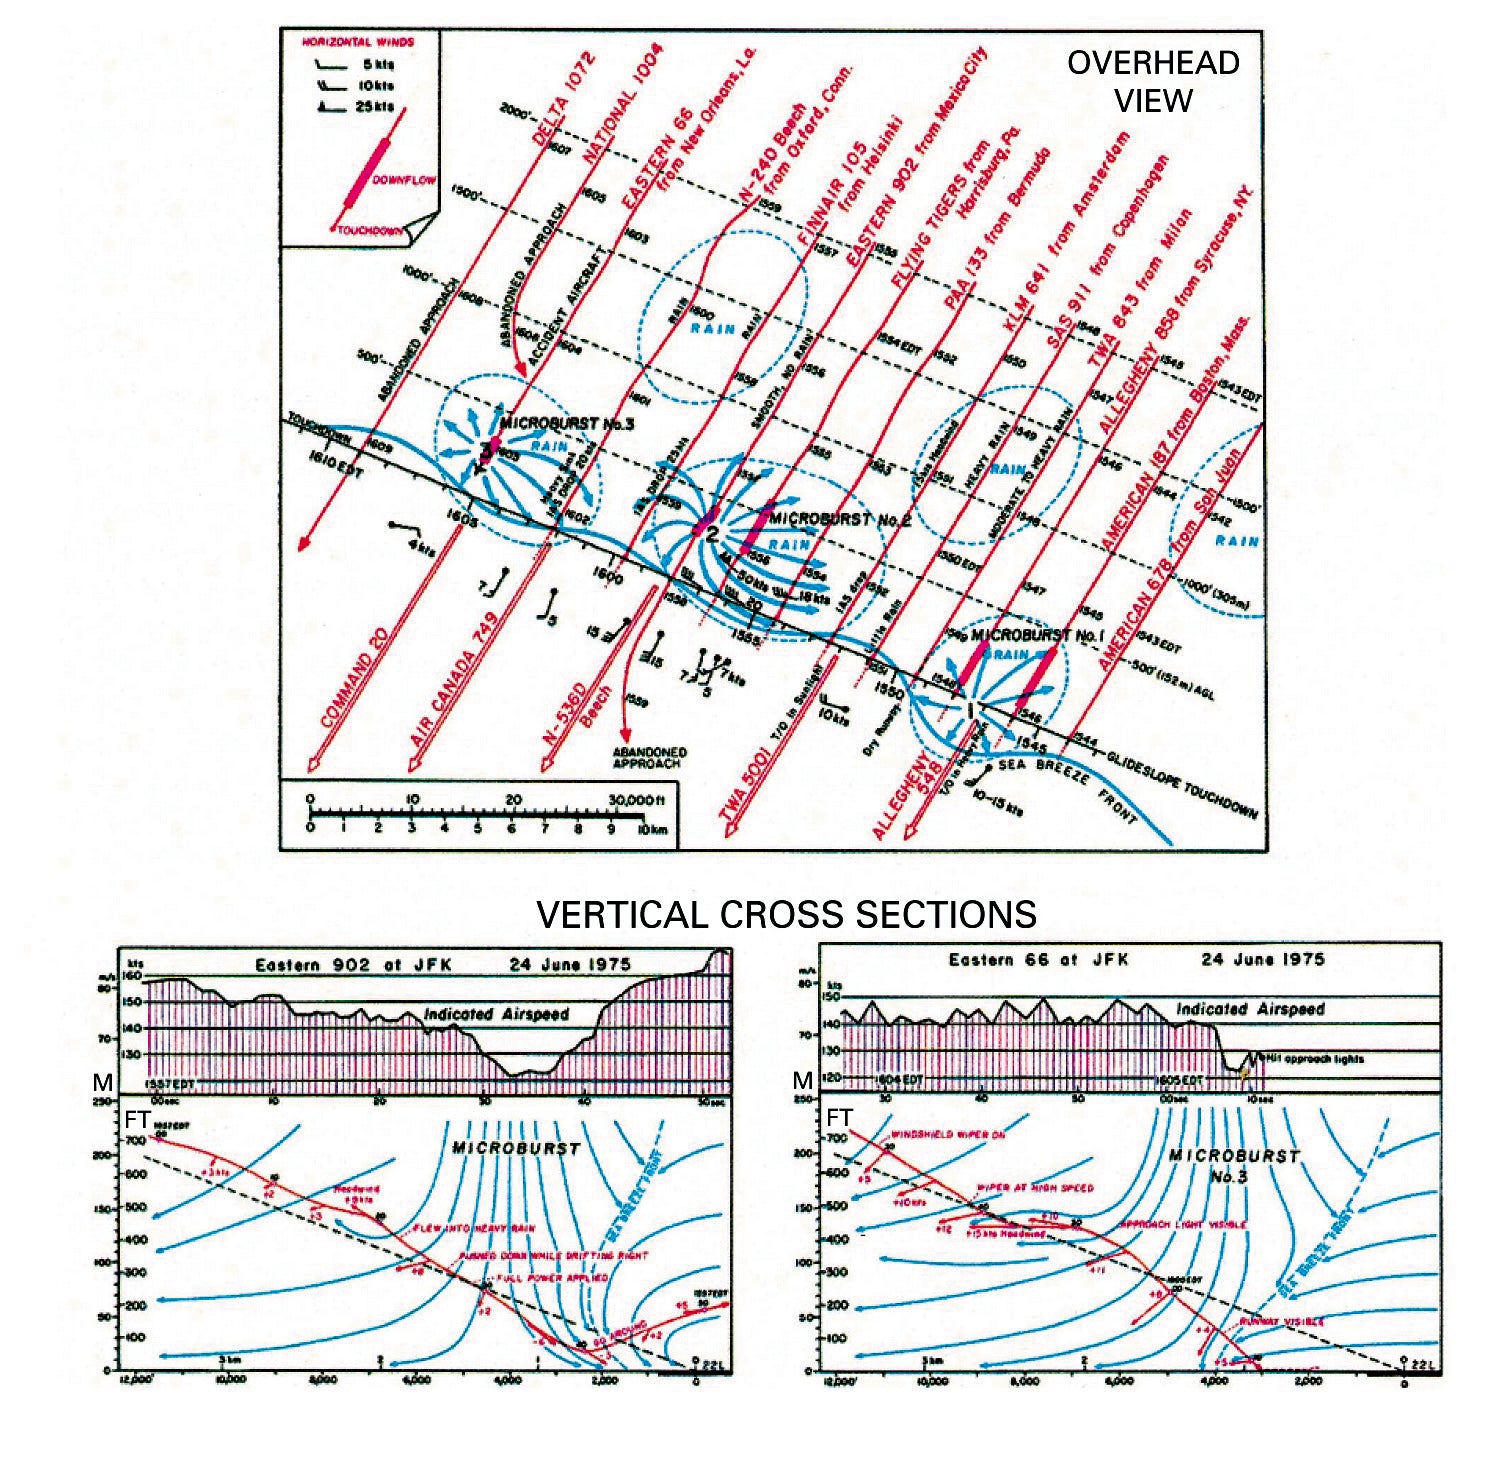
For the Eastern Flight 66 crash, Fujita examined data from all of the aircraft that flew approaches over the minutes before the crash, and built a model by fitting the storm to the data. Not surprisingly, this method was controversial. The reconstructions were thought to be not entirely scientific, drawing on hypothesized patterns in the data rather than on what the data directly showed.
However Fujita’s work showed the distinct patterns of small-scale downdrafts hammering the Runway 22L approach path. These downdrafts measured no more than a couple of miles in diameter and consisted of exceptionally sharp changes in wind vector. It was becoming clear that not all downbursts were thunderstorm scale; some could be as small as the circulation of a tornado.
Fujita eventually named these intense downdrafts microbursts. The microburst term was coined in 1978 by Fujita and entered the formal scientific literature in 1981, eventually becoming somewhat of a household word.
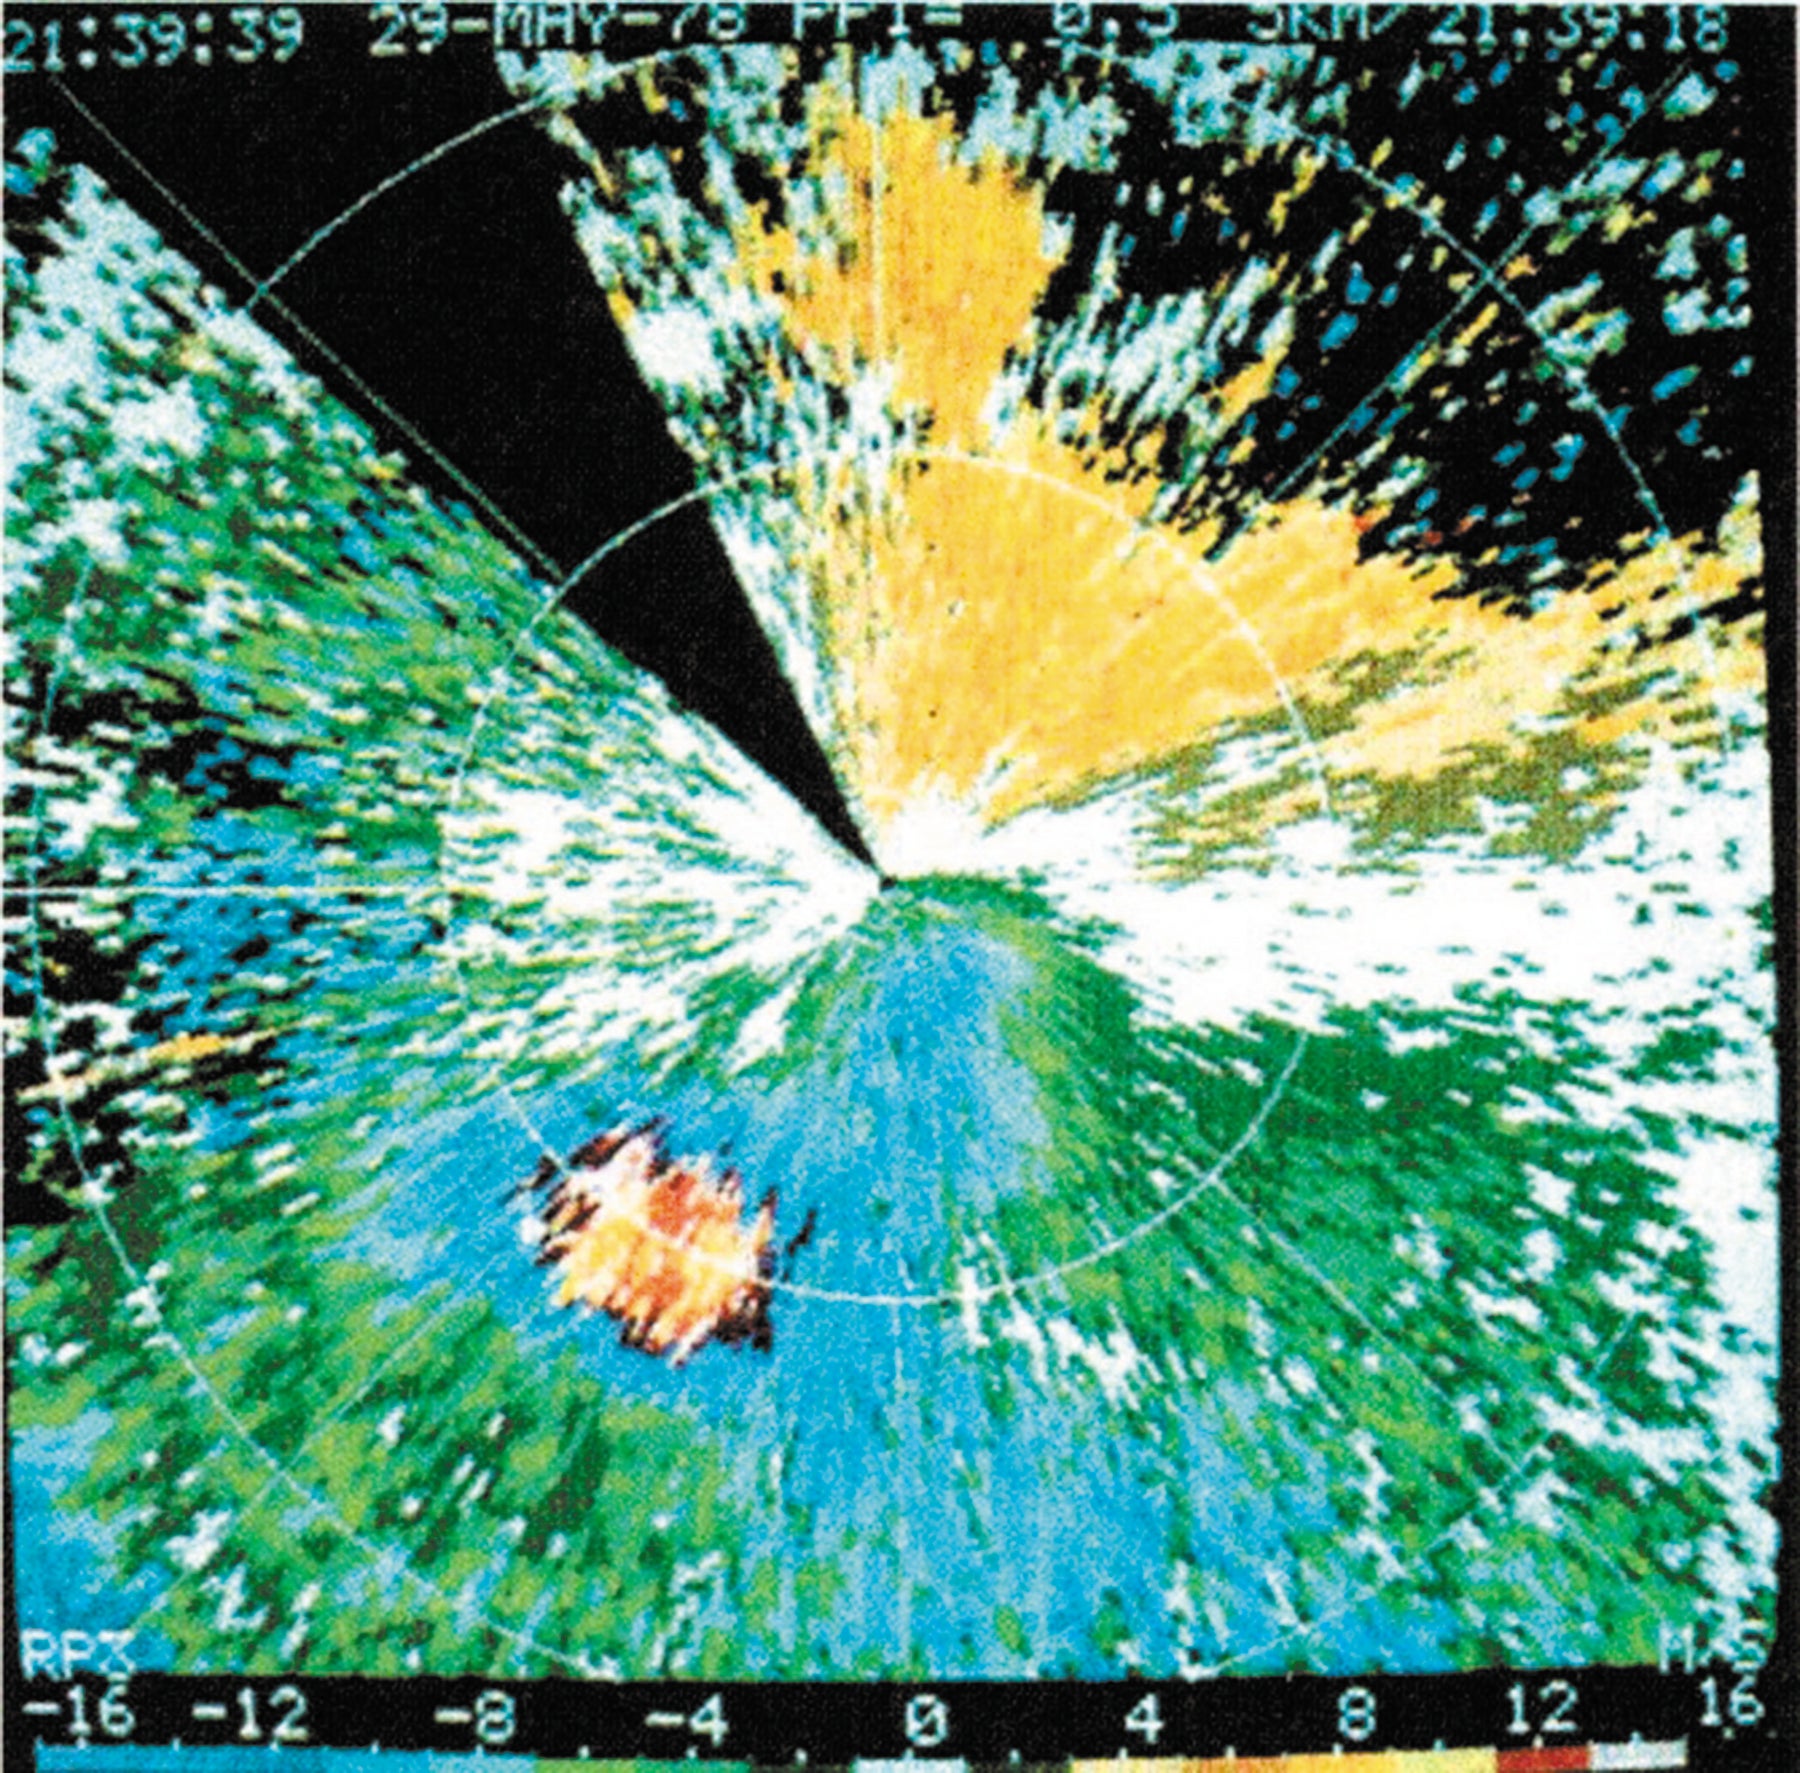
To investigate further, Fujita began collaborating in the mid-1970s with other researchers at the National Center of Atmospheric Research (NCAR) in Colorado. They offered Fujita the use of some of the first high-resolution digital Doppler radars, the predecessor to NEXRAD. Likewise, NCAR researchers felt that if Fujita was right, there was great potential to grow the science of Doppler radar observation and expand this new area of radar technology.
Although this radar offered only a two-dimensional slice in the vertical, Fujita’s theories were validated. The radars showed that thunderstorms sometimes had intense downdrafts measuring only a couple of kilometers in diameter, producing severe winds at the ground.
The great success of these efforts led to the Joint Airport Wind Shear (JAWS) project in 1982. This was a coordinated effort that combined three research radars to sample wind in three dimensions, and used ground photography to build a picture of 186 downbursts. One of the more important findings was that some of the strongest downbursts were associated with weak radar echoes, only showing green shades on airborne radar.
What We Now Know
Downdrafts, the downward “exhaust” from thunderstorms, are not new. They were identified as far back as 1841 by American scientist James Espy, who said a “violent summer shower often causes the wind to blow outward.” After all, when rain evaporates, it cools the air, which then wants to sink. This sinking air then blows outward from the storm when it reaches the ground. These downdrafts were understood in a more scientific manner by the 1900s, but it was the 1947 Thunderstorm Project that truly dissected the downdraft and proved its existence.
In 1981, Fujita explained that the smaller, more intense downbursts were still downdrafts, but acting on a smaller scale. By definition, these microbursts have diameters less than 4 km (2 NM).
Today, there’s an important distinction between downburst and microburst. The downburst refers to all intense, damaging downdrafts from a cumulonimbus cloud. Microbursts, however, are a downburst distinguished by their small scale. Downbursts are hazardous, but microbursts are even more dangerous, since smaller scales mean changes in velocity over space and time are even stronger. This directly translates to faster airspeed fluctuations and heavier accelerations on aircraft, meaning more potential for structural damage and loss of control.
However it’s important to re-emphasize that weather tends to act through a range of different scales, and that downdrafts and microbursts cannot be classed separately. With the right conditions, downdrafts can break up into microbursts, and likewise microbursts can combine upscale into large downdrafts.
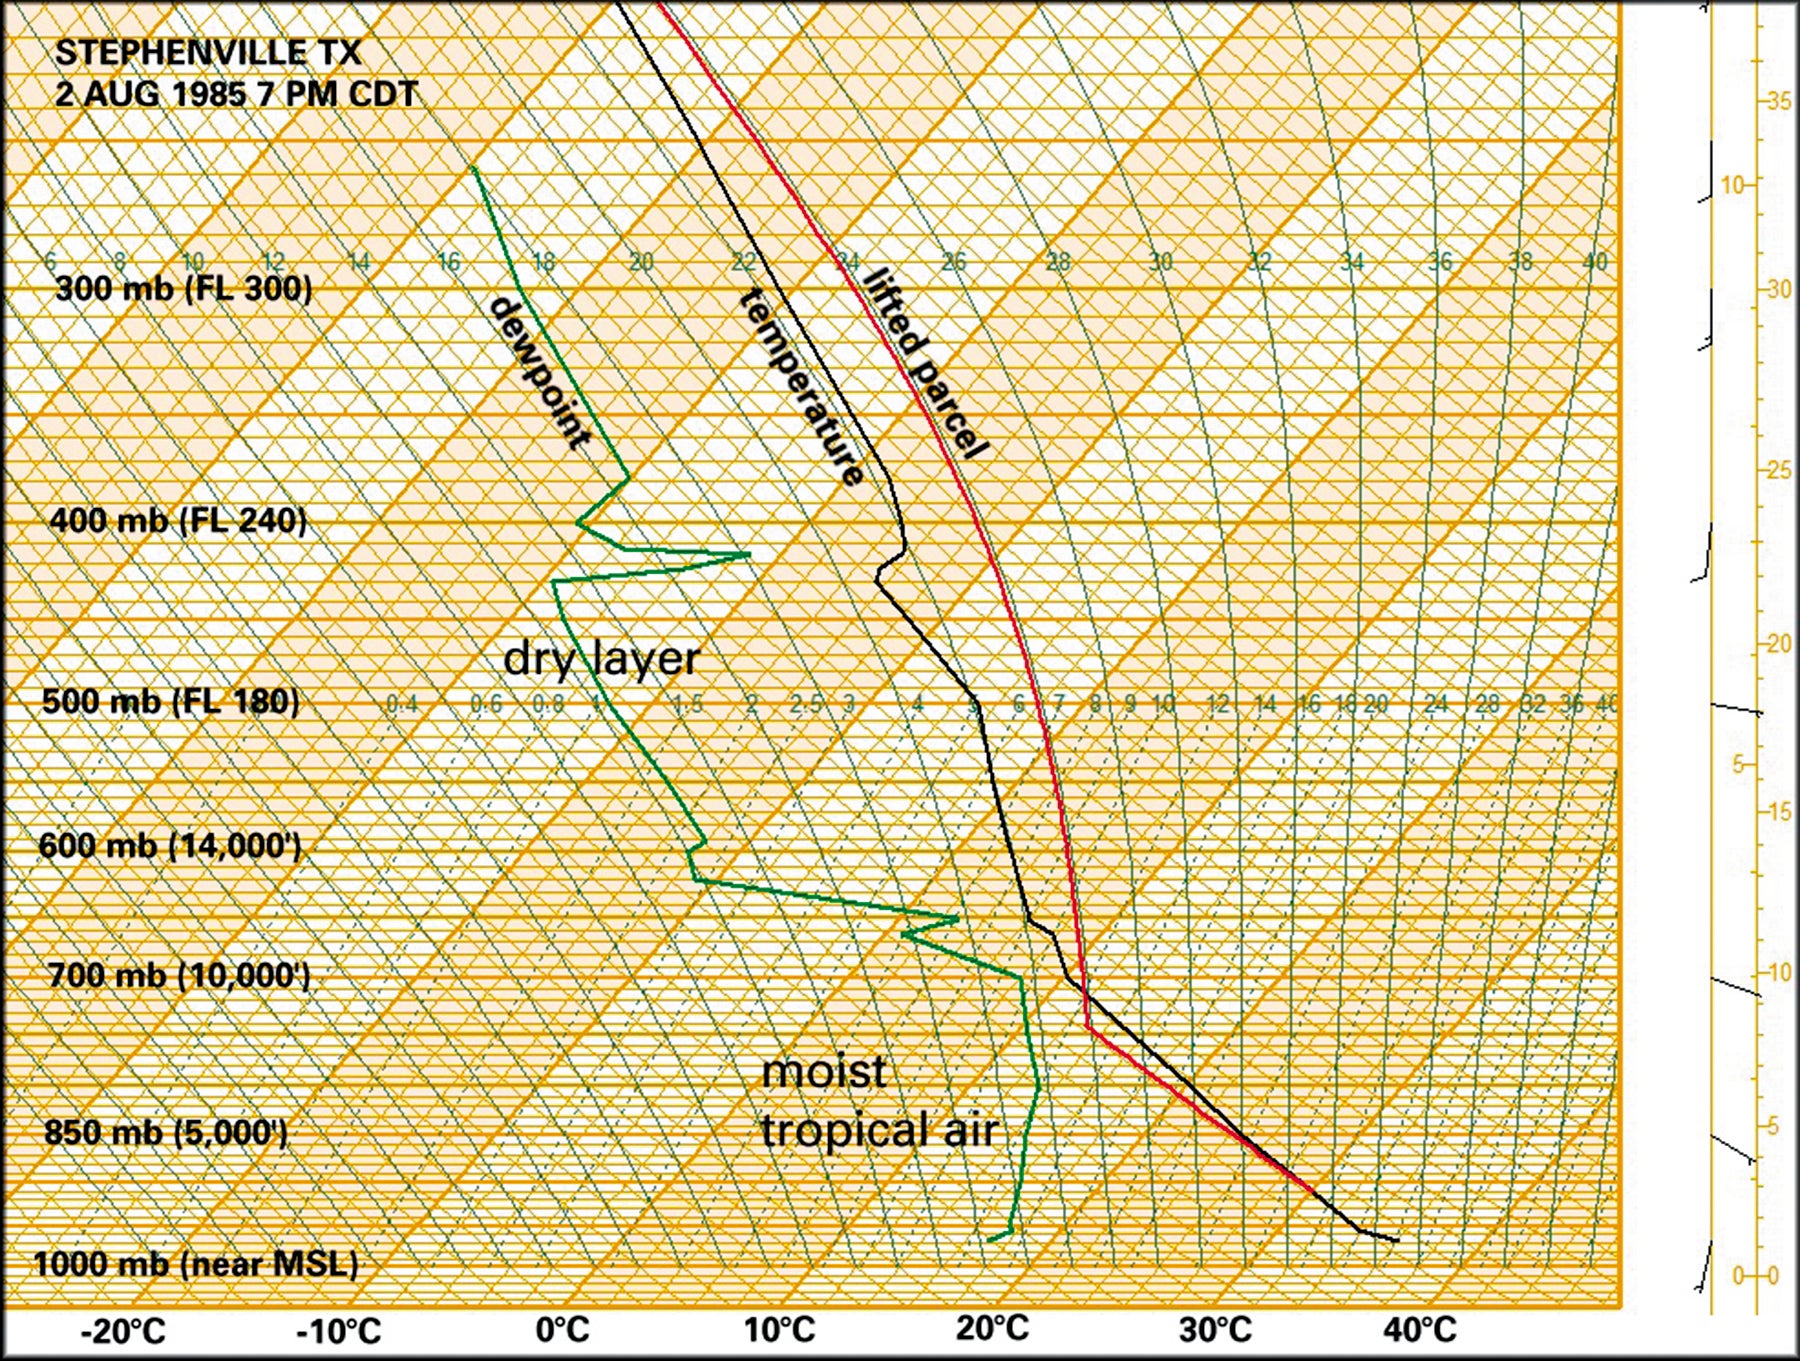
But, there are specific patterns that favor the development of microbursts. Forecasters look for conditions supporting thunderstorms, coupled with dry air aloft. Dry air aloft is key to downburst and microbursts, because it allows for massive evaporational cooling. This dry air picks up significant kinetic energy as it descends. Aircraft caught in this downburst can encounter descents that exceed their climb rate. Small, heavily loaded general aviation aircraft are especially vulnerable.
This can be easily visualized on a sounding. Generally dry air exists above 10 to 15,000 feet MSL, and the lower the dewpoint in those layers (the further the space between the dewpoint and temperature lines on the sounding), the greater the downburst potential.
Forecasters also use a quantitative measurement called DCAPE (downdraft convective availability of potential energy), expressed in joules per kilogram. This attempts to relate the buoyancy in the lower troposphere, where thunderstorm fuel can transfer moisture to the upper levels, versus the dryness of the upper troposphere, where it can be transformed again into a dense mass of falling air. You can find DCAPE measurements on sites like weather.com and the Storm Prediction Center.
The Rest Of The Story
The August 1985 crash of Delta Air Lines Flight 191 at DFW Airport immediately dominated the evening news. The L-1011 jet crossed a strong downburst while on final approach. The sudden change of a headwind to a tailwind caught the crew by surprise, and the aircraft impacted the ground. The crash claimed 136 out of the 163 lives on board.
This crash led to renewed wind shear training. Flight simulators were configured with actual data from microbursts. New training was developed to offer flight control techniques that could be used in such situations. Finally the FAA sponsored a series of training videotapes developed by NCAR to help pilots understand and deal with wind shear.
Although Doppler radar data was being implemented nationwide as part of NEXRAD at the time of the Delta crash, the FAA led development of its own Terminal Doppler Weather Radar (TDWR), which is in use at major airports and can be viewed on apps such as RadarScope. The TDWR system is similar to NEXRAD but operates in the C-band rather than the S-band. This brings more problems with attenuation by rain, but better performance sampling wind fields in and around major airfields.
Your Defense
So how can you avoid a microburst? It starts with planning.
Is it a downburst day? Check the Storm Prediction Center convective outlook and go through the text. If you see mention of high wind potential, that’s a prime indicator that wind shear is possible and extra caution is needed. If the outlook says nothing in particular, your usual storm precautions should suffice.
Next, see your local forecast discussion at aviationweather.gov. Here you can read exactly what’s on the aviation forecaster’s mind in that particular area.
And of course don’t just collect your SIGMET; read it. All SIGMETs indicate gust potential. If you see gusts of 50 knots or more, there’s a potential for wind shear in storms. This gust information is developed by forecasters based on experience and tools like DCAPE.
Onboard radar won’t keep you out of trouble. High intensities are created by heavy rain and possible hail, but not by high winds. However circular “cores” on airborne radar along your approach and takeoff path correlate strongly to downdrafts and downbursts. These are always a strong indicator that you should wait things out before penetrating them.
Finally, make use of your visual cues! There’s much more to see by looking at the sky than what online and remote sensing tools provide. The development of virga (vertical fallstreaks underneath clouds), rain curtains not yet reaching the ground, dense rain curtains, “foot” shaped rain shafts, and fuzzy cloud bases around showers and thunderstorms are strong indicators of downburst formation. If your other indicators also suggest gusty winds and wind shear, you should avoid flying near these cloud features at all costs.
This article originally appeared in the July 2020 issue of IFR magazine.
For more great content like this, subscribe to IFR!