Homebuilt Accidents: Fatal Factors
To the owner of an Experimental Amateur-Built (E/A-B) aircraft, any accident is a tragedy. However, the FAA monitors the homebuilt accident rate based on fatal accidents only. It’s understandable, in…
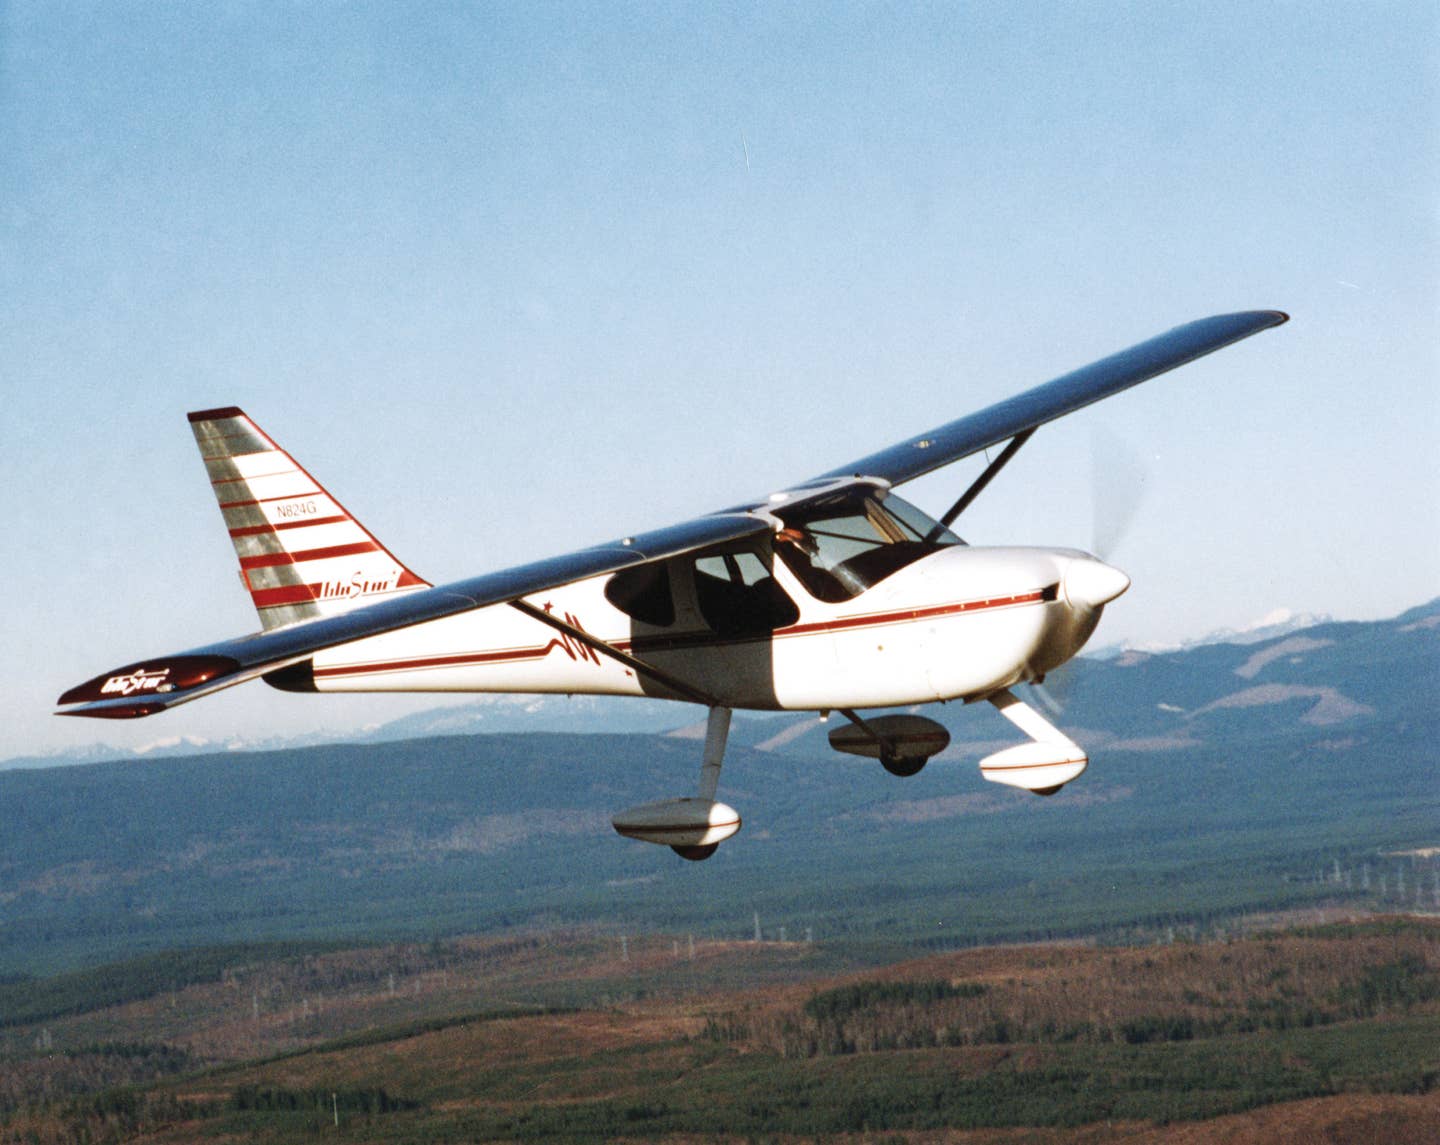
The GlaStar Sportsman line saw about 60 accidents from 1998 through 2017, of which only seven were fatal.
To the owner of an Experimental Amateur-Built (E/A-B) aircraft, any accident is a tragedy. However, the FAA monitors the homebuilt accident rate based on fatal accidents only.
It’s understandable, in some ways. Unlike owners of production aircraft, builders of homebuilt aircraft are usually very familiar with disassembling and transporting a bent bird. A minor enough accident and the temptation is strong to grab the pieces and stuff them out of sight before the local constabulary shows up.
I know of at least two cases where the owner and his friends dashed the wreckage into a hangar and shut the door before outsiders arrived. One man swore up and down to a news crew that he didn’t know anything about a plane accident. He was standing with one arm in a sling and a crunched rudder tucked under the other.
But accidents resulting in death are nearly impossible to hide. They receive the highest attention from investigating agencies. This is good, as they are the cases where the builder or pilot made the worst kind of mistakes. By learning what is more likely to kill us, we have a better chance of avoiding a serious accident ourselves.
Injury Severity
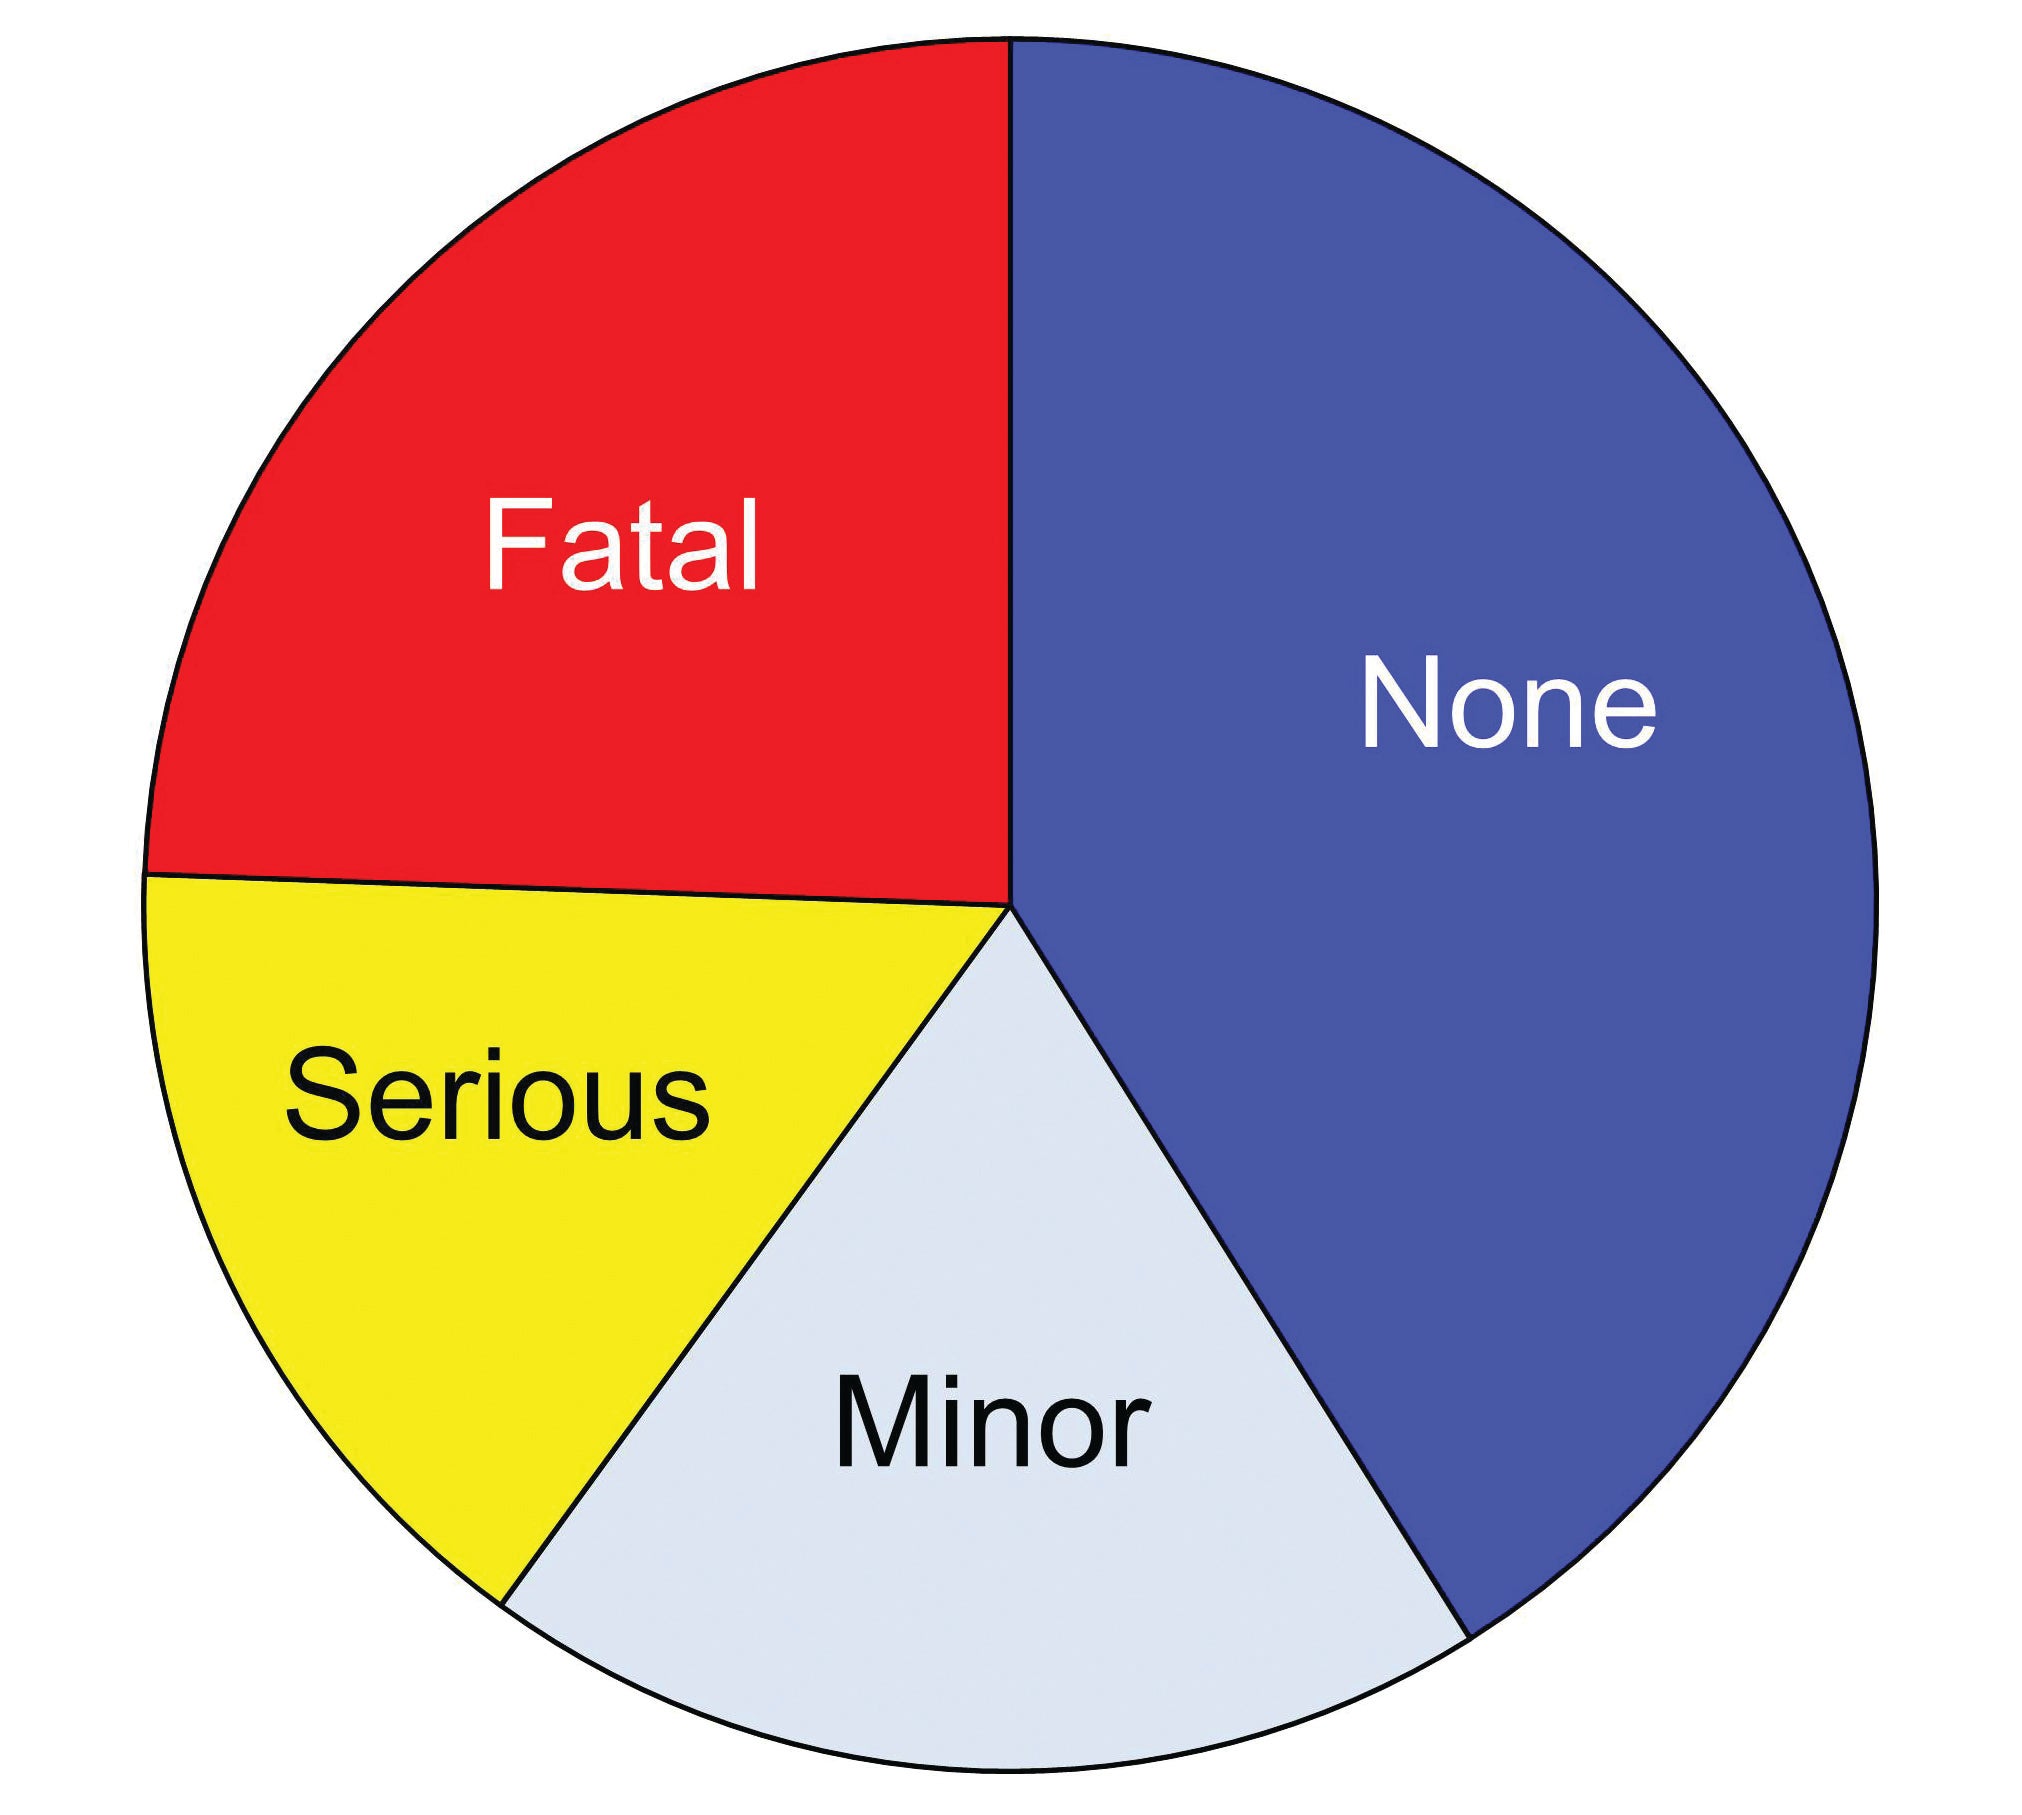
We can find the fatal accidents through the “Injury Severity” entry in the NTSB records. Searchers using their web page can select only “Fatal” and “Non-Fatal,” but the downloadable database actually has four injury categories: Fatal, Serious, Minor, and None.
“Fatal” is unambiguous. But to be considered as related to a given accident, the NTSB requires that the death occur within 30 days. Injuries are rated as “Serious” if they require hospitalization for more than 48 hours, involve broken bones (other than simple fractures of fingers, toes, or nose), severe bleeding, and/ or 2nd or 3rd degree burns over more than 5% of the body surface.
The NTSB doesn’t define “Minor” injuries, but one can assume that it’s a level less than “Serious” but still not “None.”
For the analysis to come, we’ll combine the “None” and “Minor” categories.
What Kills Us
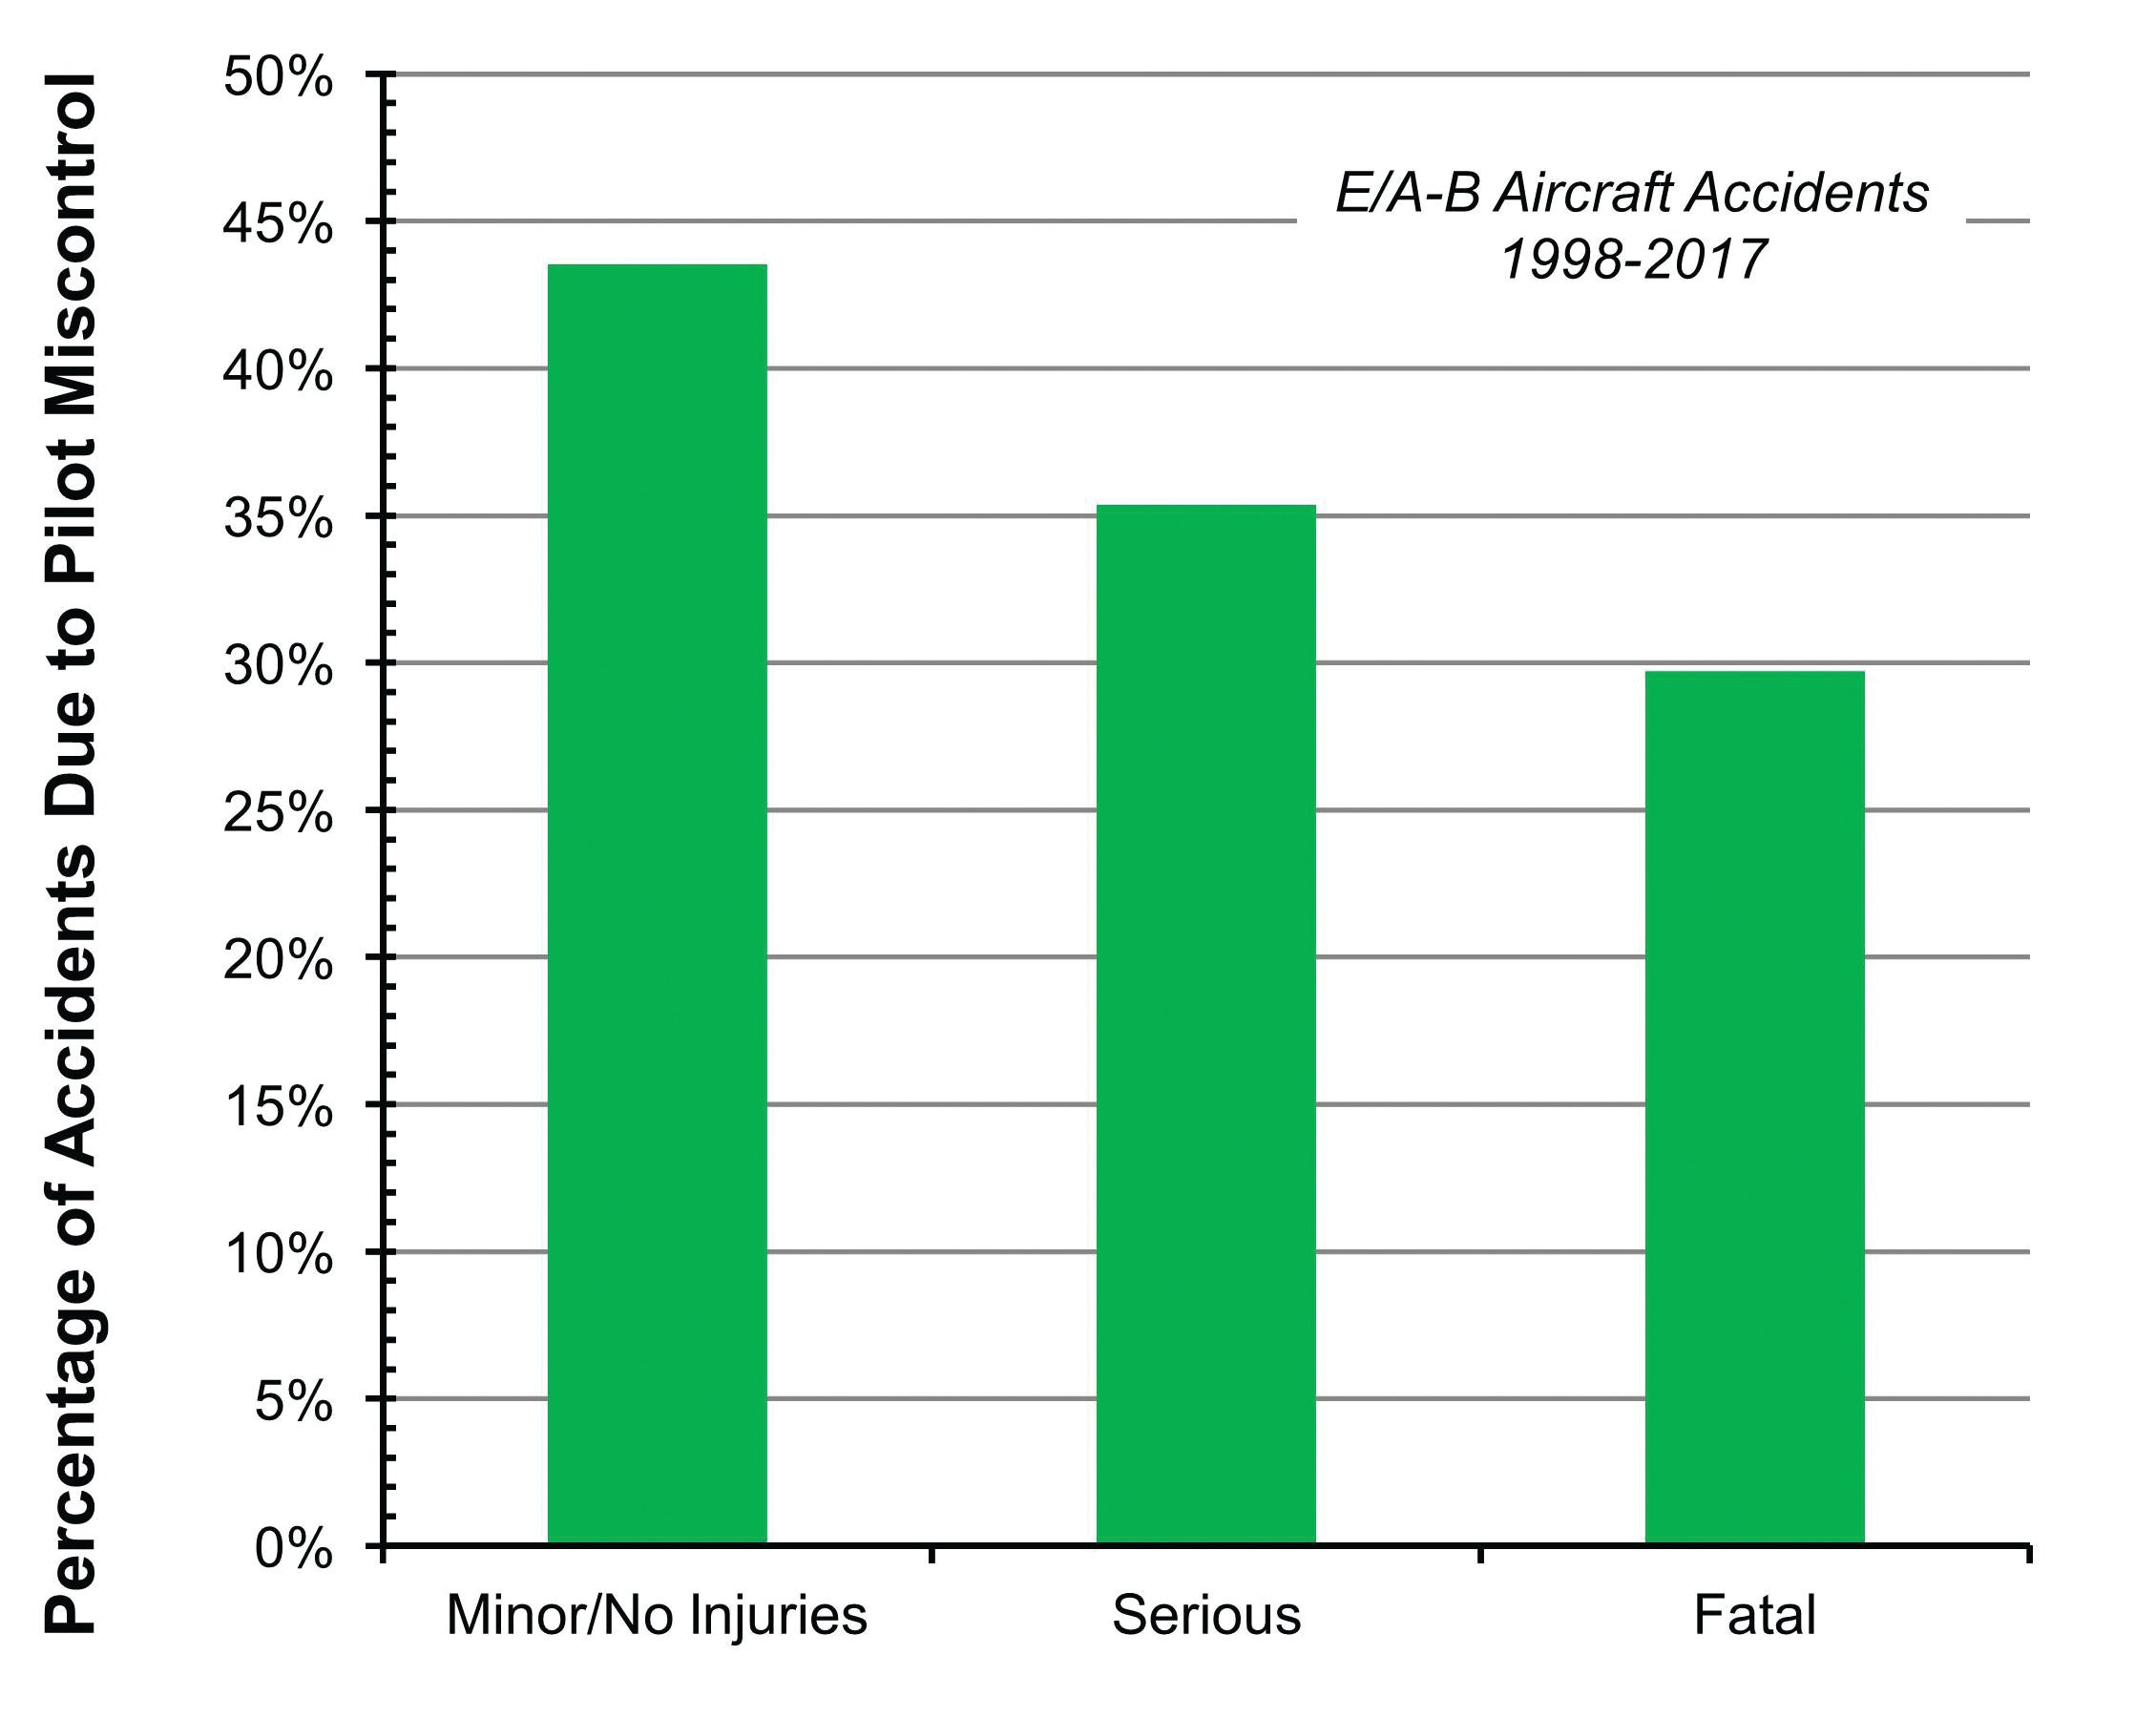
Pilot miscontrol—errors made in the control or guidance of the aircraft—is the major cause of homebuilt accidents regardless of injury severity. What may be surprising is that the percentage of pilot miscontrol decreases with accident severity: As seen in Figure 1, pilot miscontrol is the major cause for over 43% of the “Minor/None” injury category, but slightly less than 30% in the fatal cases.
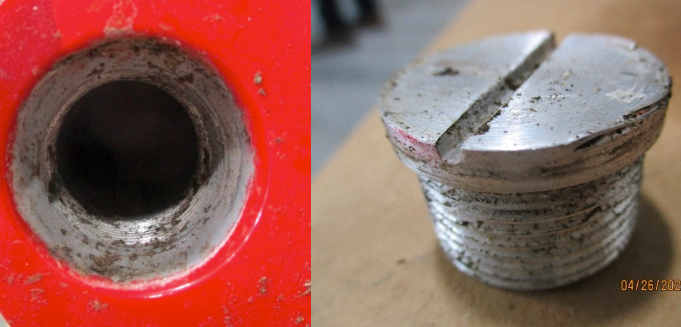
So, what else kills us? Figure 2 compares the rate of occurrence of various causes when pilot miscontrol is excluded. Builder and maintainer errors are involved less as the severity increases. Simple engine failures (engine mechanical, fuel system issues, running out of gas, carburetor icing, etc.) are less likely to result in fatalities, as well. Other than pilot miscontrol, then, what drives fatal accident statistics?
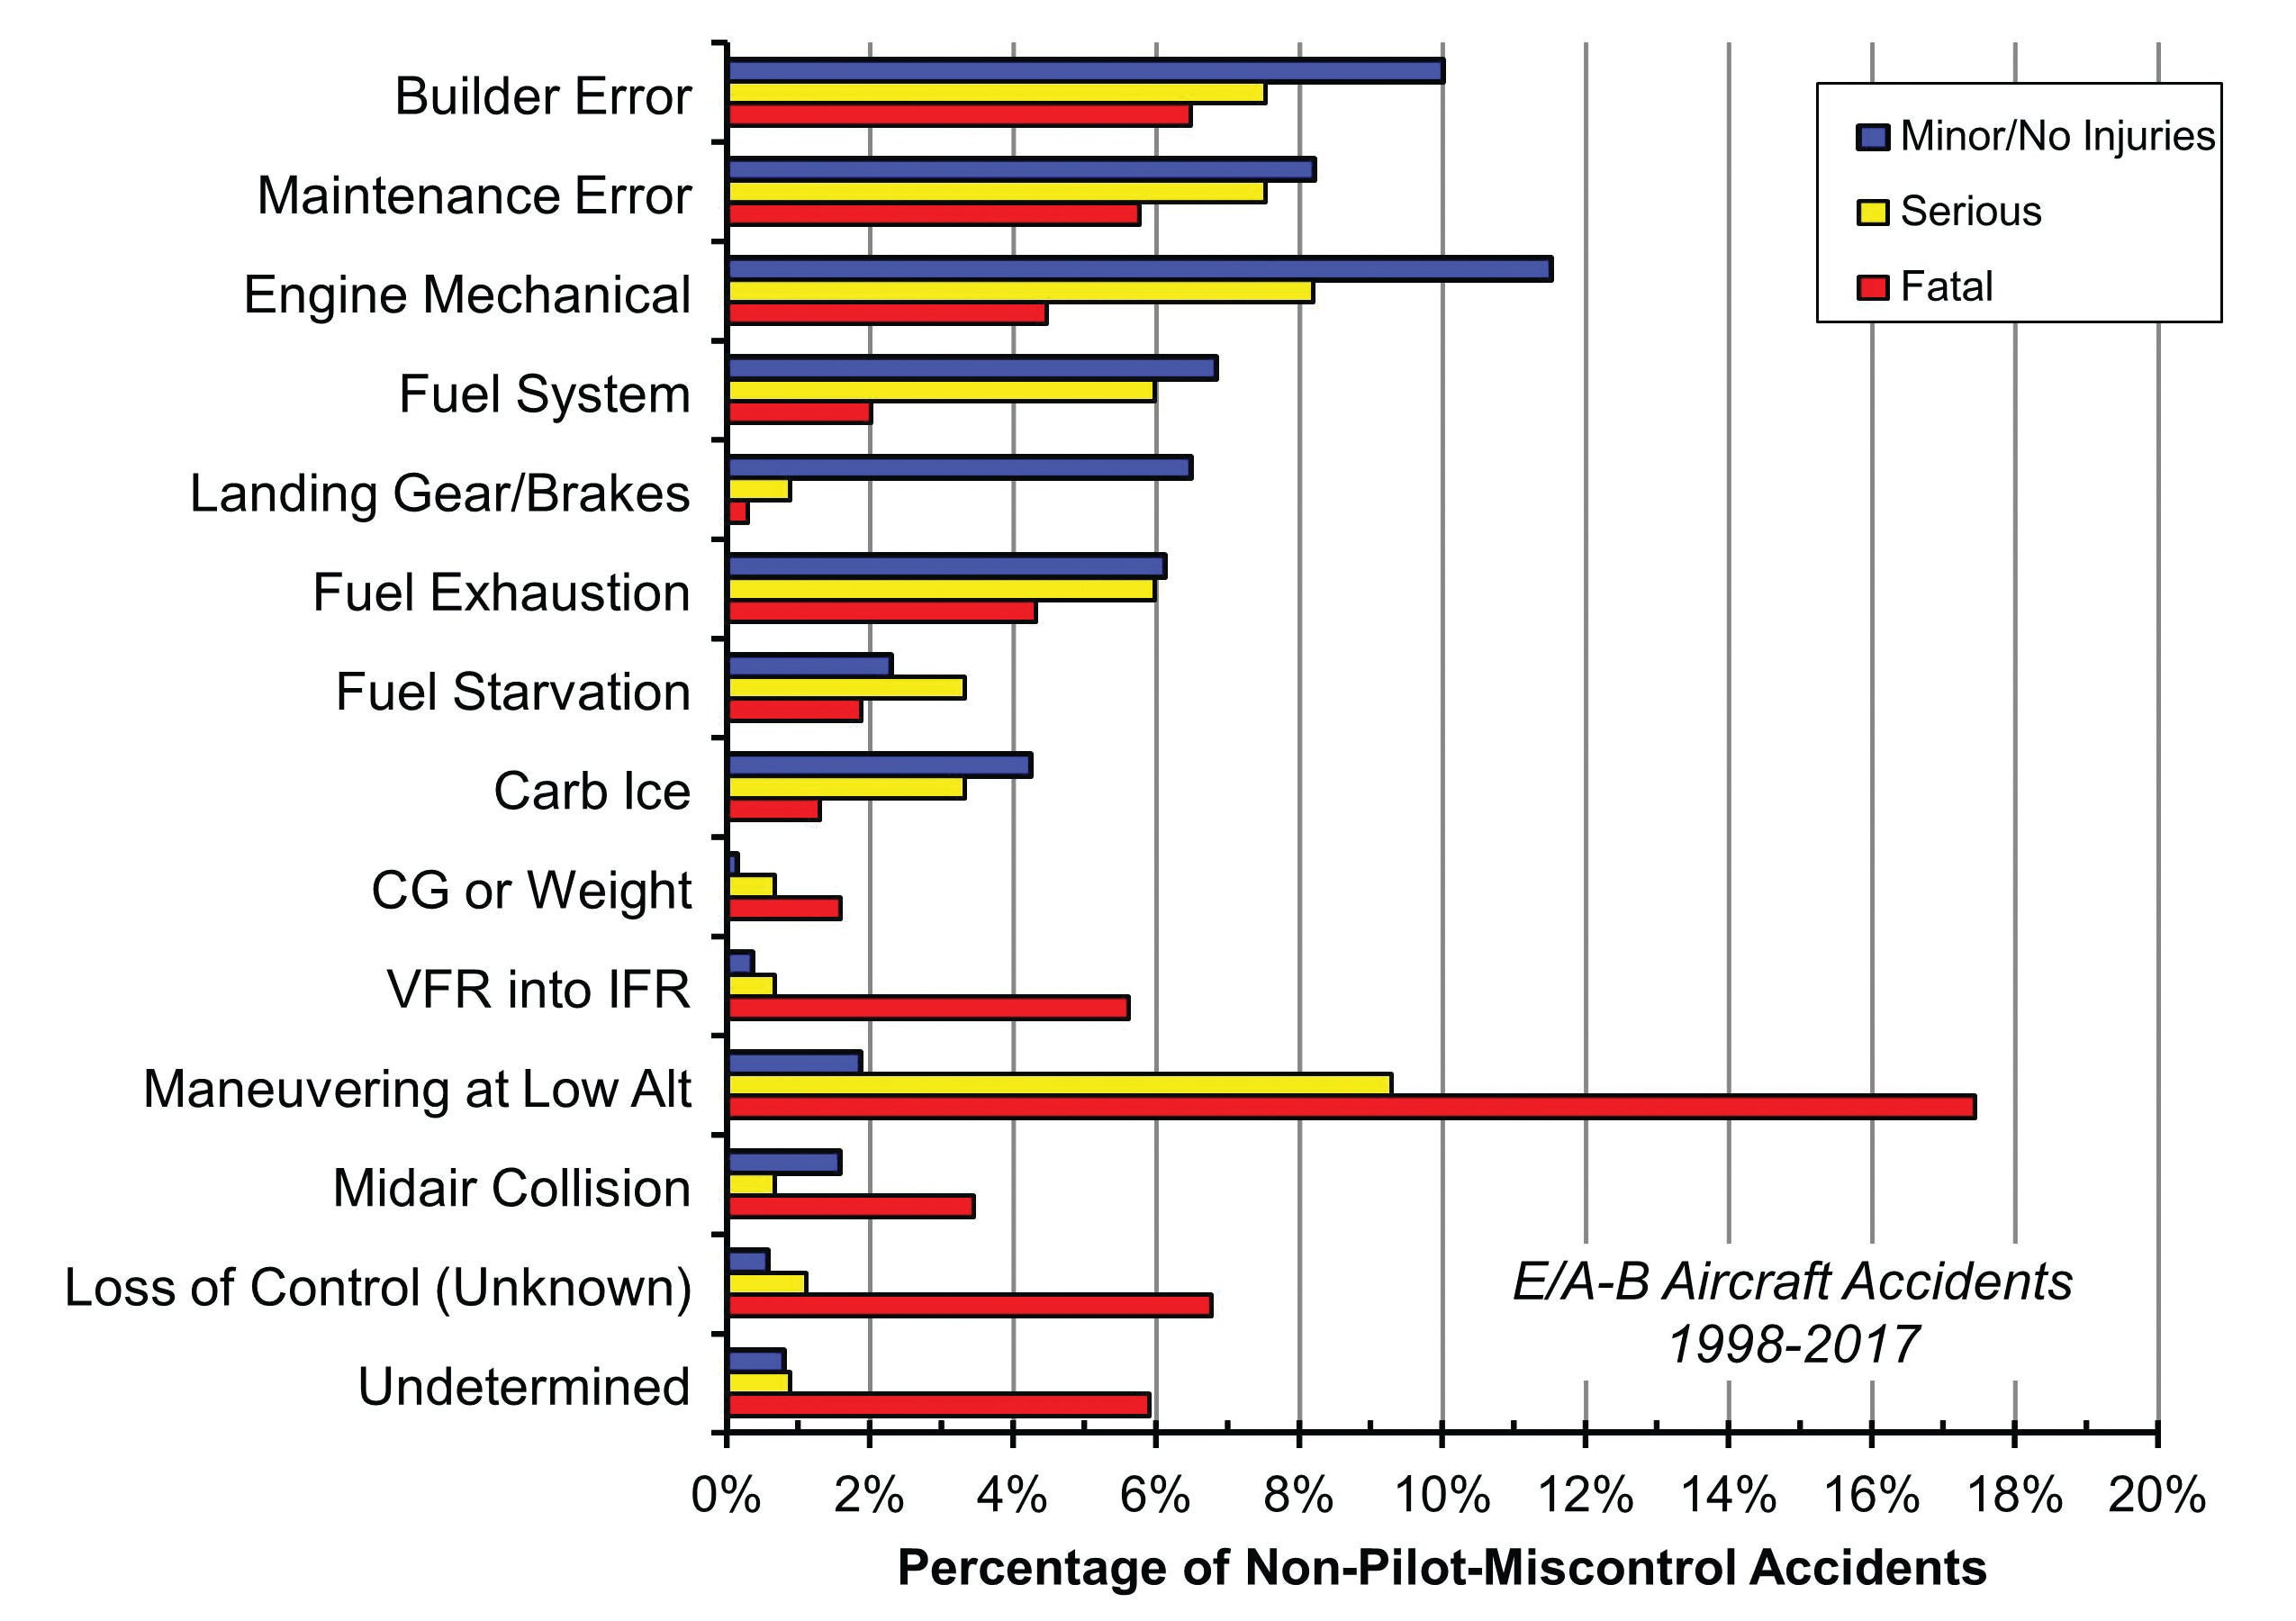

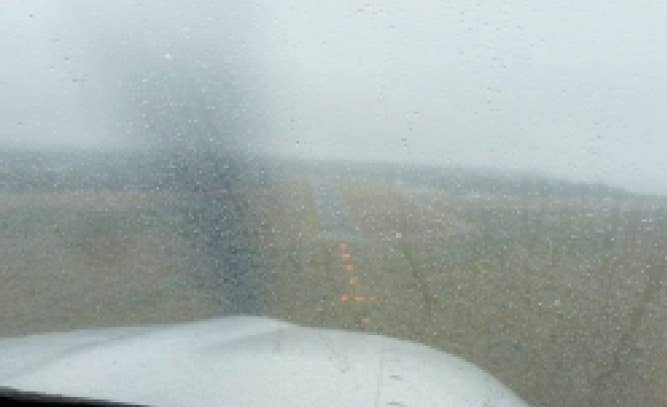
Pilot judgment issues. Nearly a quarter of the cases involve a deliberate decision by the pilot—mostly unnecessary low flying or continued VFR into IFR.
We can’t compute a “risk factor” associated with these practices since we don’t know how often pilots successfully buzz or scud run. We generally just find out if they die doing it.
But what the statistics say is that if you do crash during one of these activities, it’s probably going to kill you. Two-thirds of all low flying accidents are fatal, as is a stunning 83% of crashes resulting from continued VFR into IFR conditions.
Fatal Accident Rate
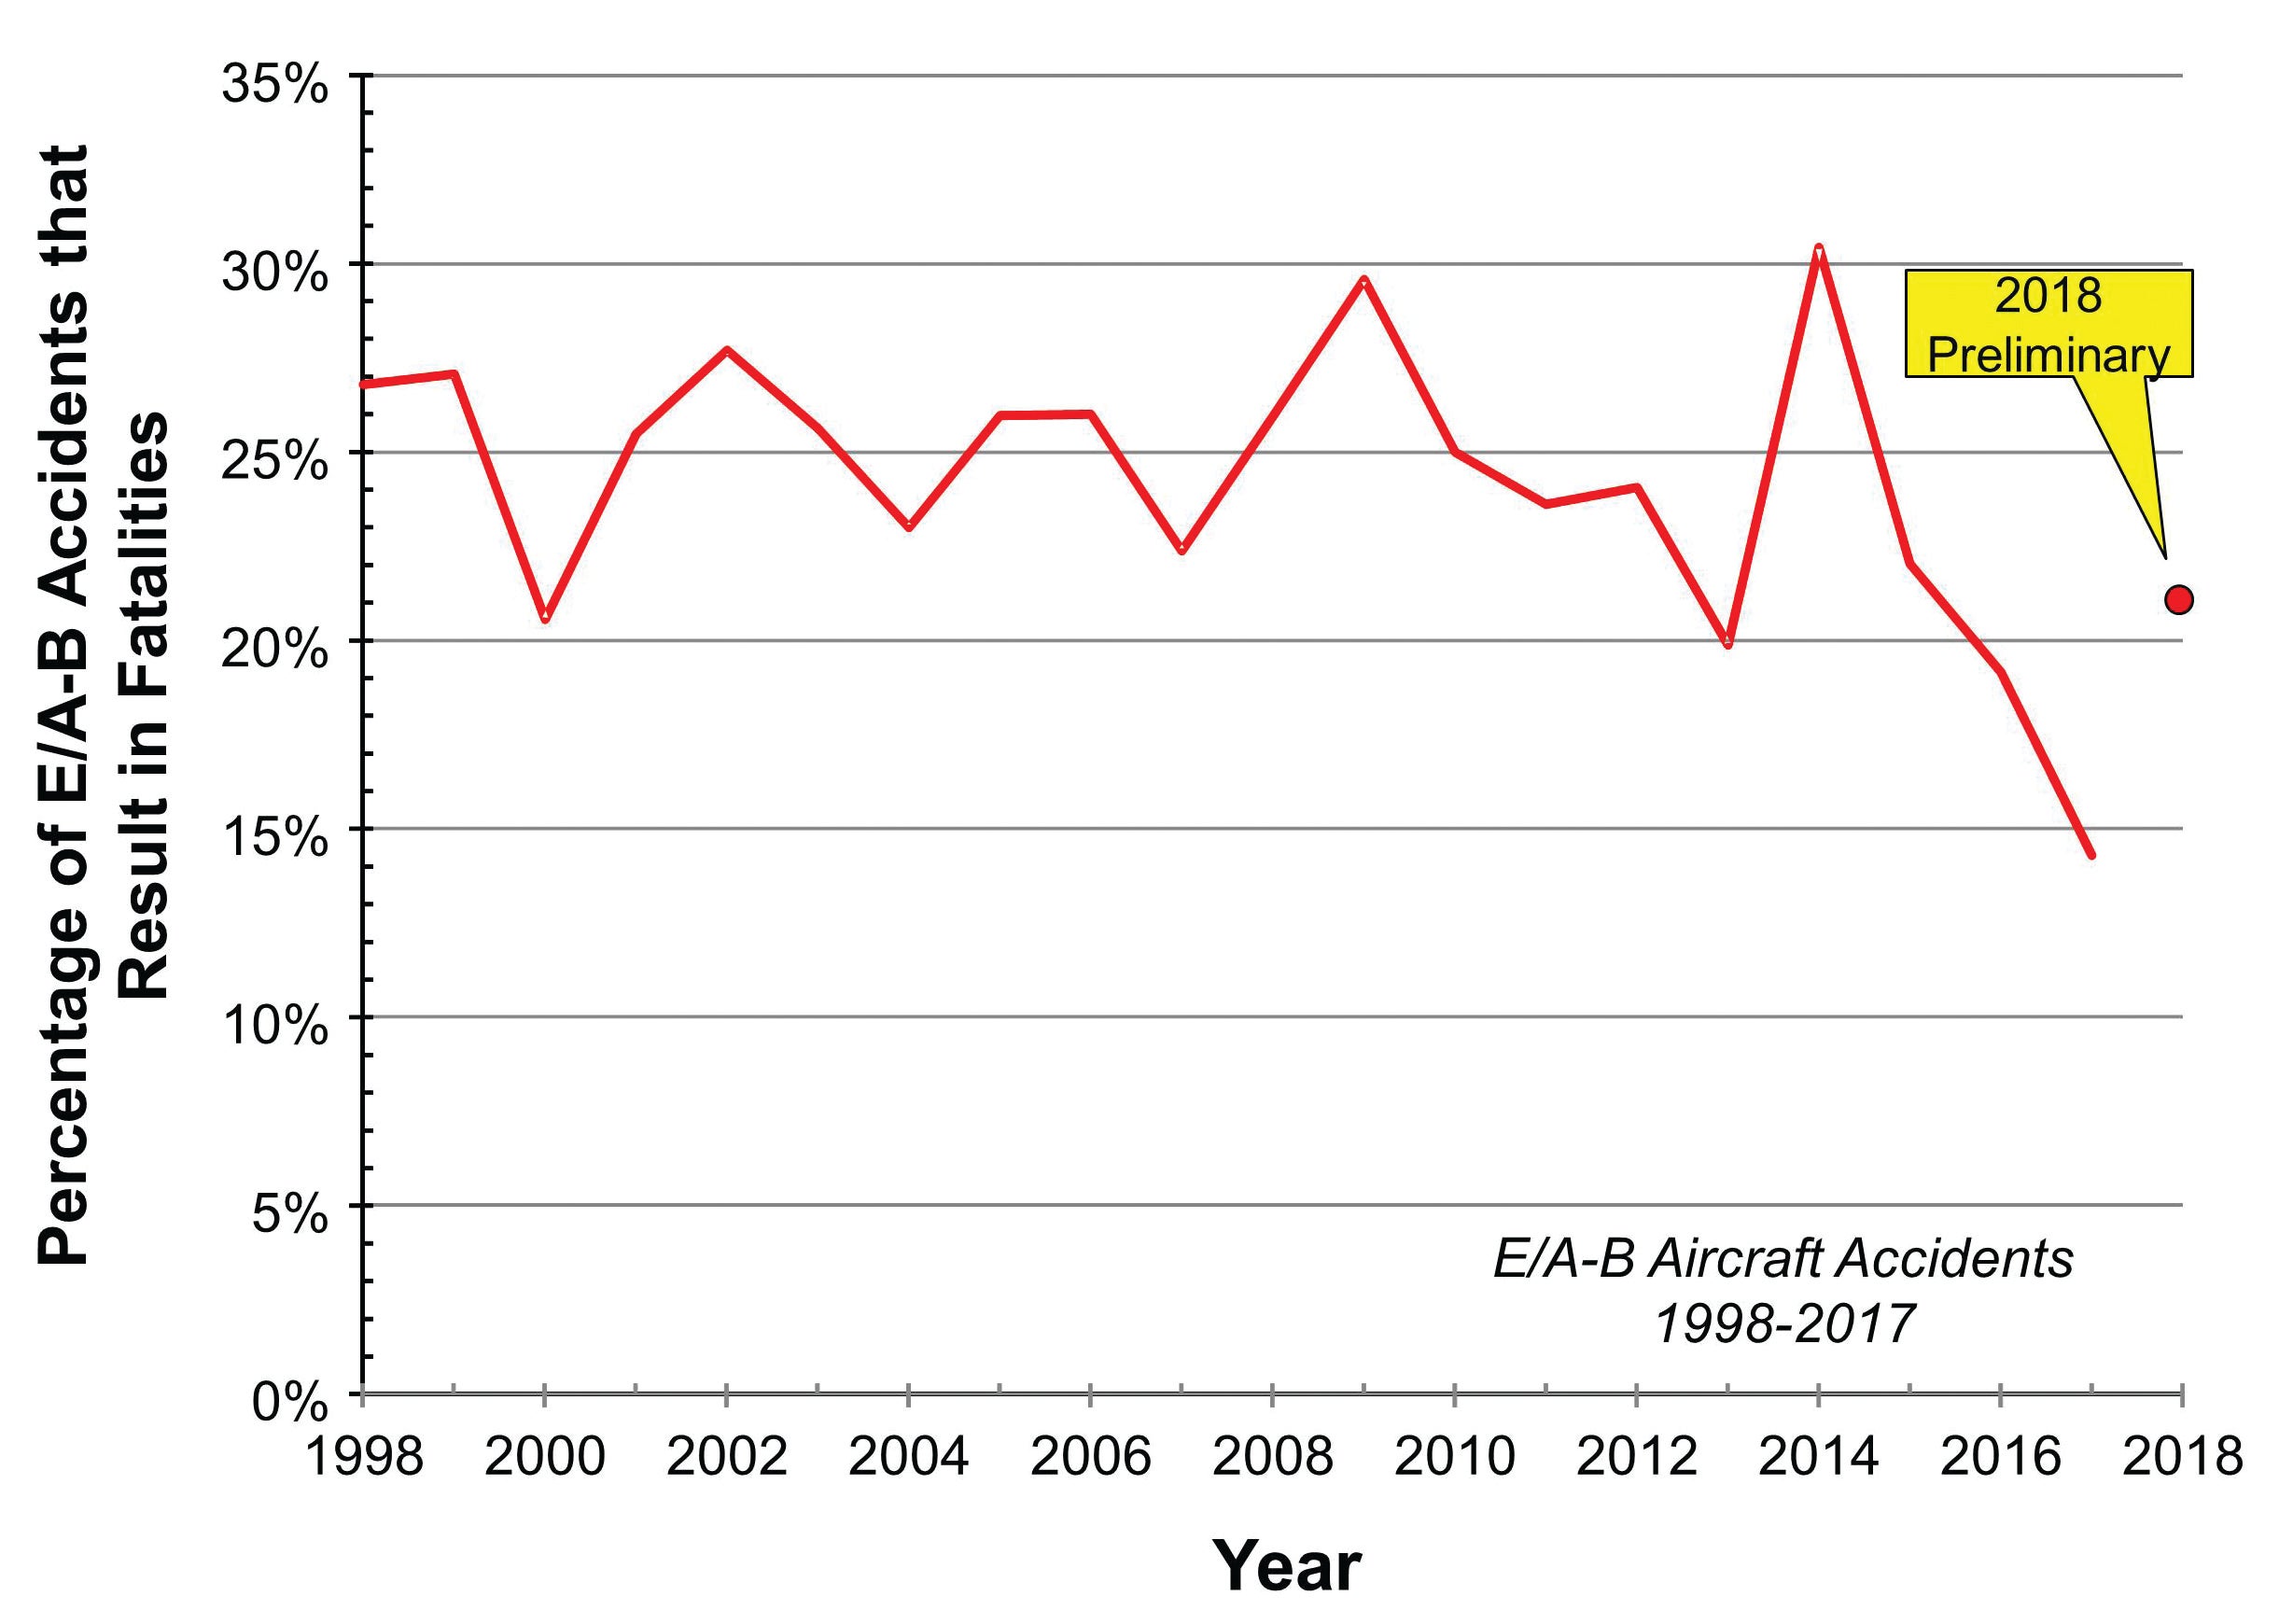
As mentioned earlier, about a quarter of homebuilt accidents result in fatalities. Figure 3 plots the “Fatal Accident Rate” (the percentage of accidents that produce fatalities) per year from 1998 through 2017. Overall, for that 20-year period, the average is 24.3%.
The overall GA rate is about 18%, so homebuilts are a bit worse. Figure 4 compares the E/A-B fatal accident rate against that of several types of common production GA aircraft.
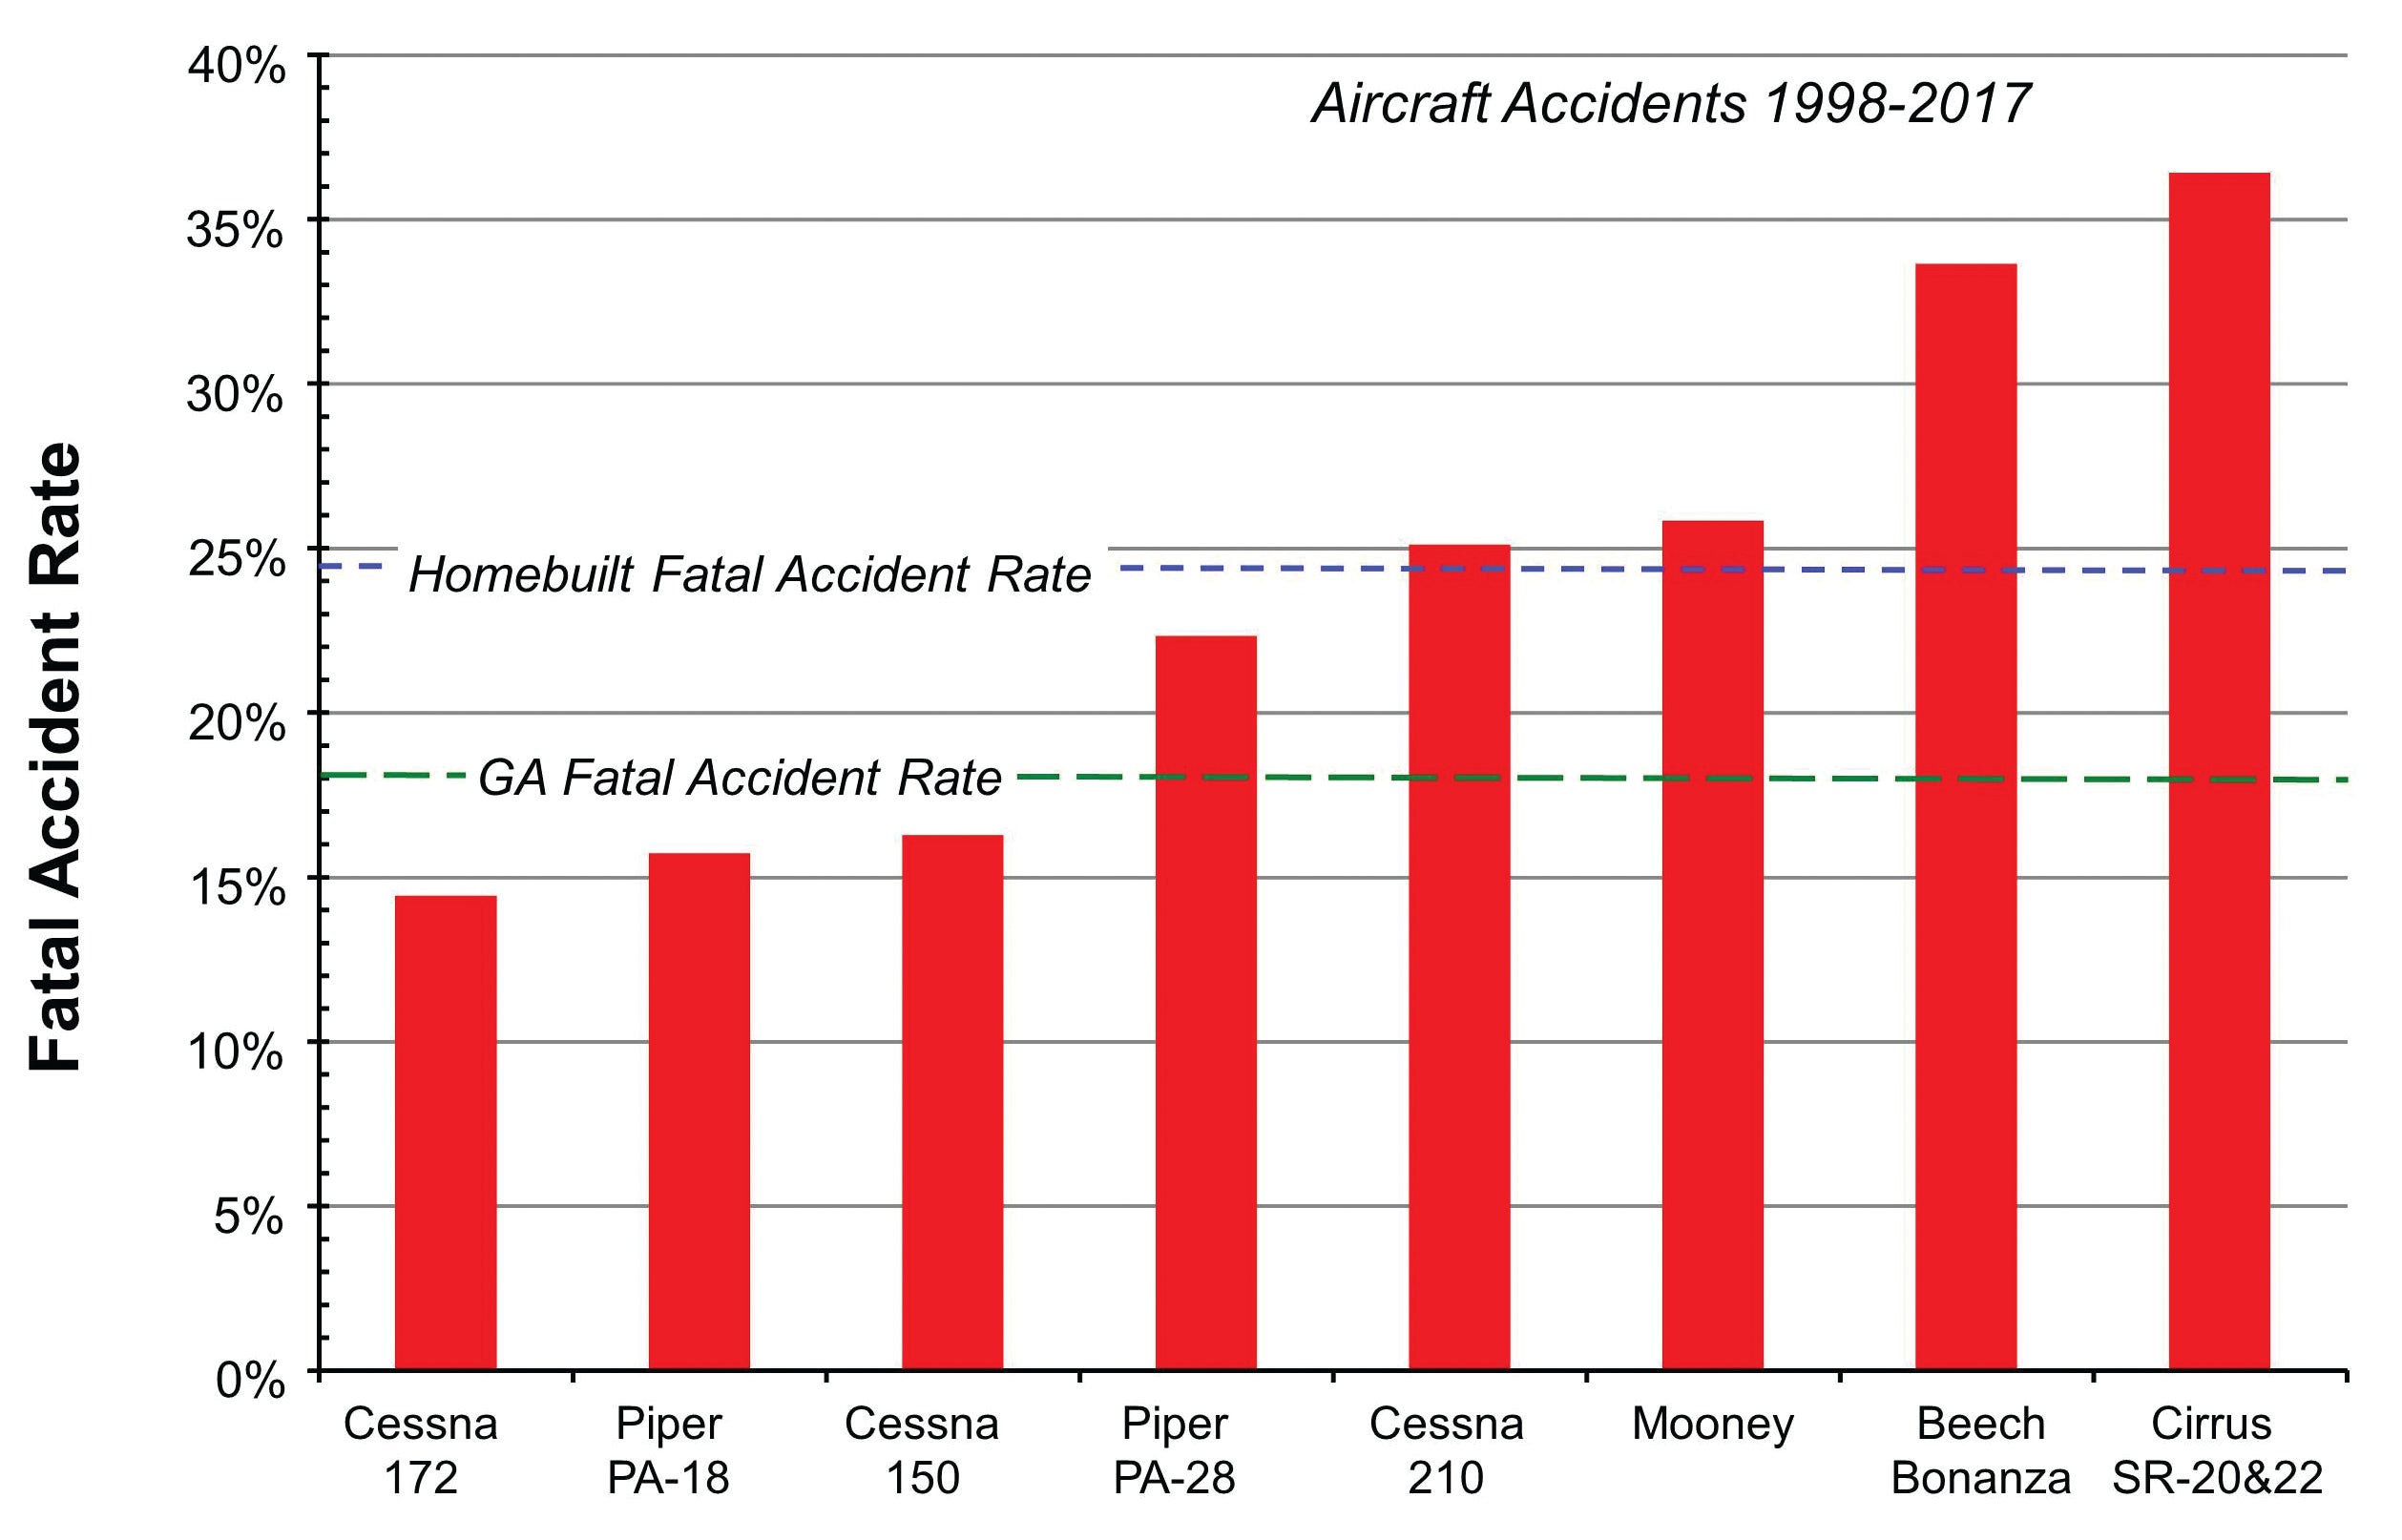
What drives whether an accident results in a fatality?
Two things: The first is the aircraft’s speed at impact. The energy involved in an accident depends on the weight of the aircraft multiplied by the square of its speed at impact. A Lancair IV on approach has about six times the energy of a Pietenpol. Which leads to the second factor: If an accident occurs, the occupants’ survival depends on the ability of the structure to protect the occupants from the liberated energy.
Generally, designers of homebuilts haven’t included crashworthiness when developing their aircraft. But it wasn’t a factor considered during production of most GA aircraft, either. Sure, airplanes designed to modern standards like the Cirrus and Diamond have occupant-protection features. But the average light GA aircraft is 45 years old. Safety features like airbags and deformable structures weren’t too common back then.
Looking back at the overall picture, it seems logical that fast airplanes would have a higher fatality rate. Figure 5 plots the rates for a variety of homebuilt and production-aircraft types against the aircraft’s cruise speed. (Why cruise instead of stall speed? Because its cruise speed will reflect how quickly an airplane might accelerate after a loss of control. It’s interesting to note that most lethal of accidents—continued VFR into IFR conditions, buzzing, etc.—do occur near cruise speed.) As expected, a higher fatality rate is found among airplanes that can fly faster.
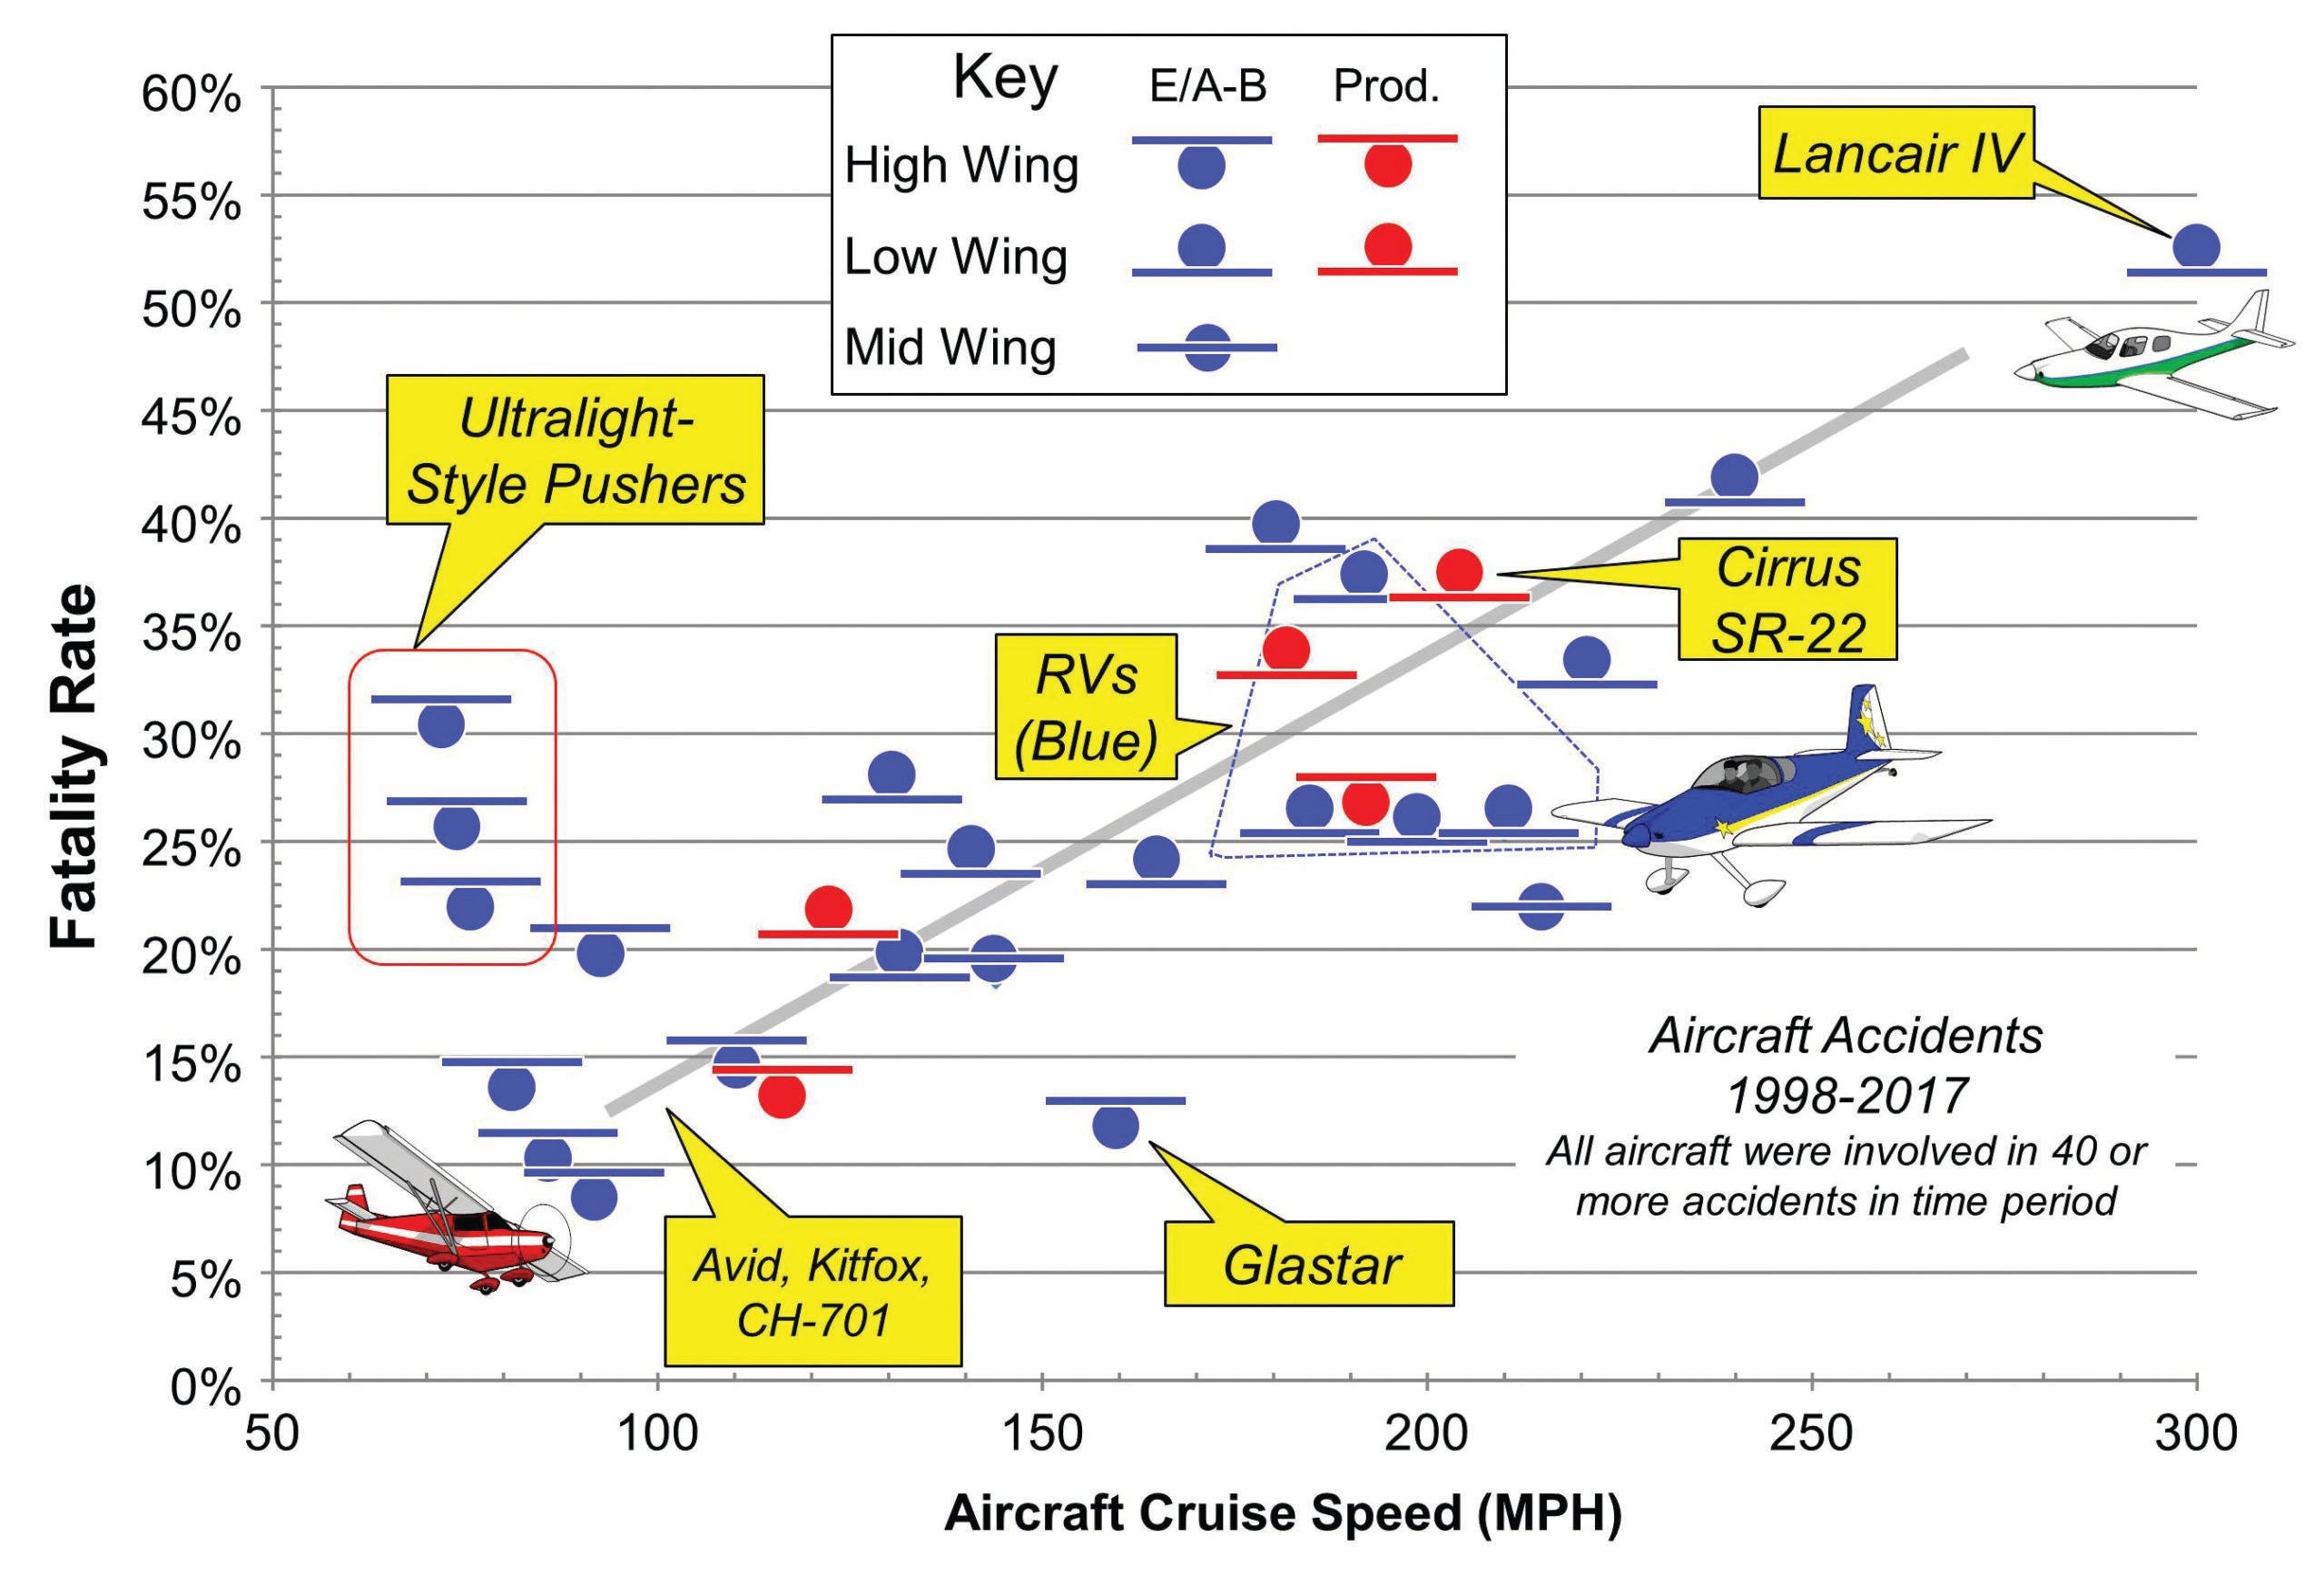
Here’s a bit of a curiosity: Figure 5 also shows the wing position of each aircraft—high, low, or mid (typically canards). Note when a speed range has both low- and high-wing airplanes: The fatality rates of the high-wing airplanes are almost always lower.
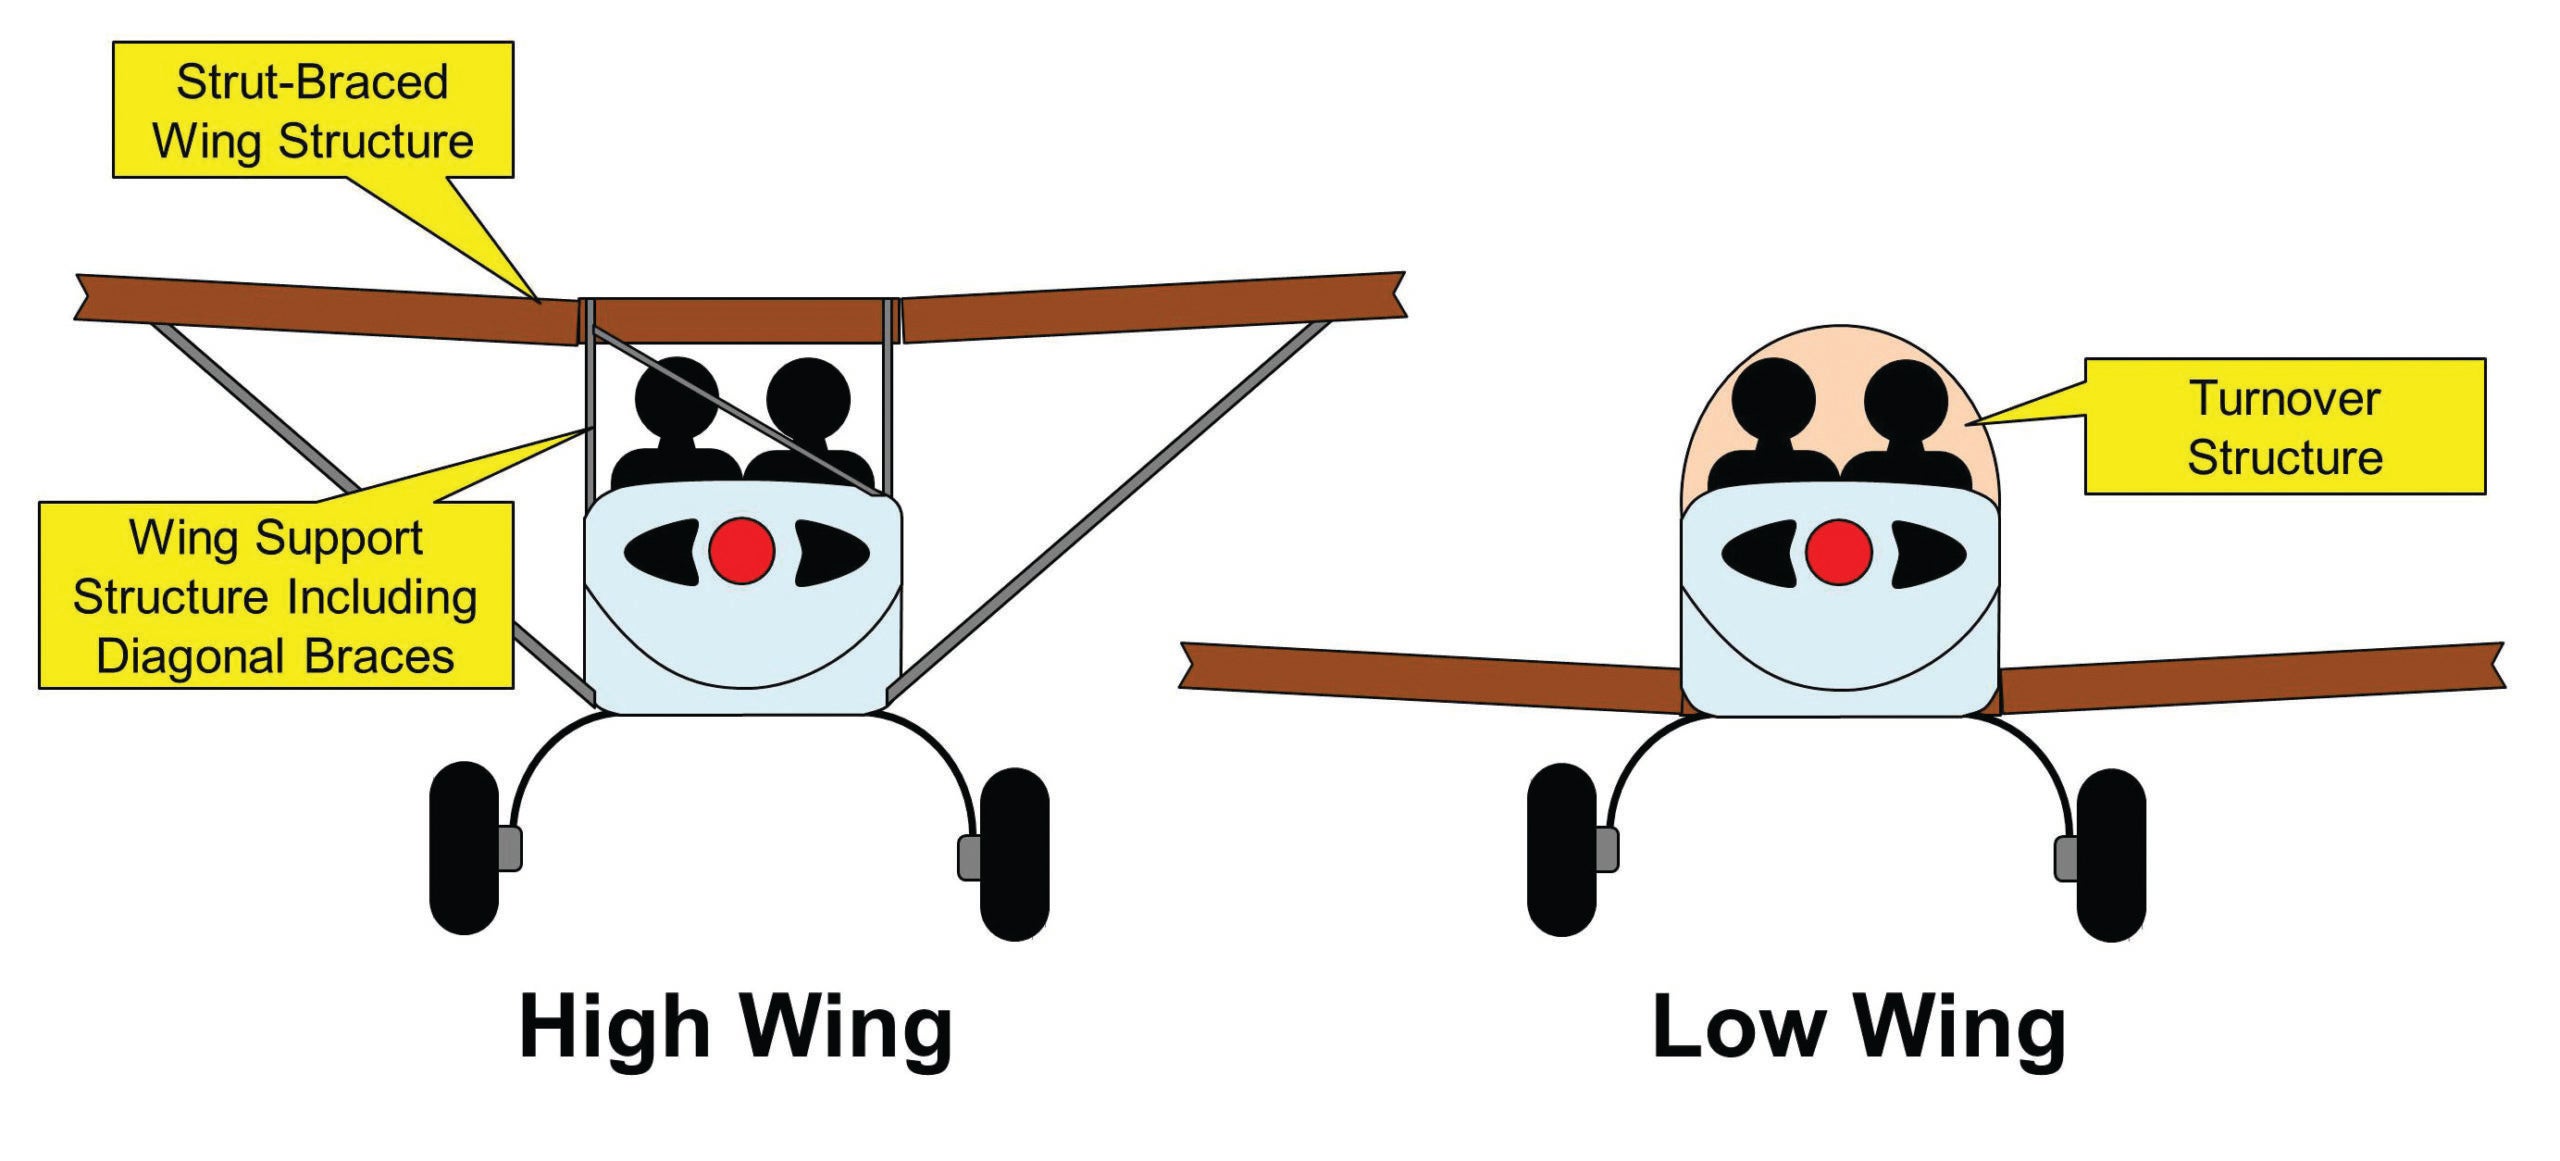
Why is this? A high-wing airplane generally surrounds the cabin with a structural cage. As long as the occupants are prevented from bashing their heads into that structure, a high-wing airplane probably offers better protection. Speaking of protection, the figure shows three “ultralight type pushers” at the low end of the speed range with an elevated fatality rate. Sure, they fly slow. But the occupants sit forward of the main structure of the aircraft and aren’t well protected by it. Their fatal accident rate probably reflects less protection that results from this configuration.
It probably comes to no one’s surprise that the Lancair IV has the highest fatal accident rate. But if one projects a straight line through the middle of the results (ignoring the ultralight-style pushers) to approximate a speed vs. fatality rate ratio, you’ll find the Lancair IV falls generally on that line. Given its high cruise speed, its fatality rate is about what one would expect.
Finally—note that the results for the homebuilt airplanes (blue symbols) are very similar to those of production airplanes (red symbols). E/A-B aircraft are actually doing pretty well.
Wrap Up
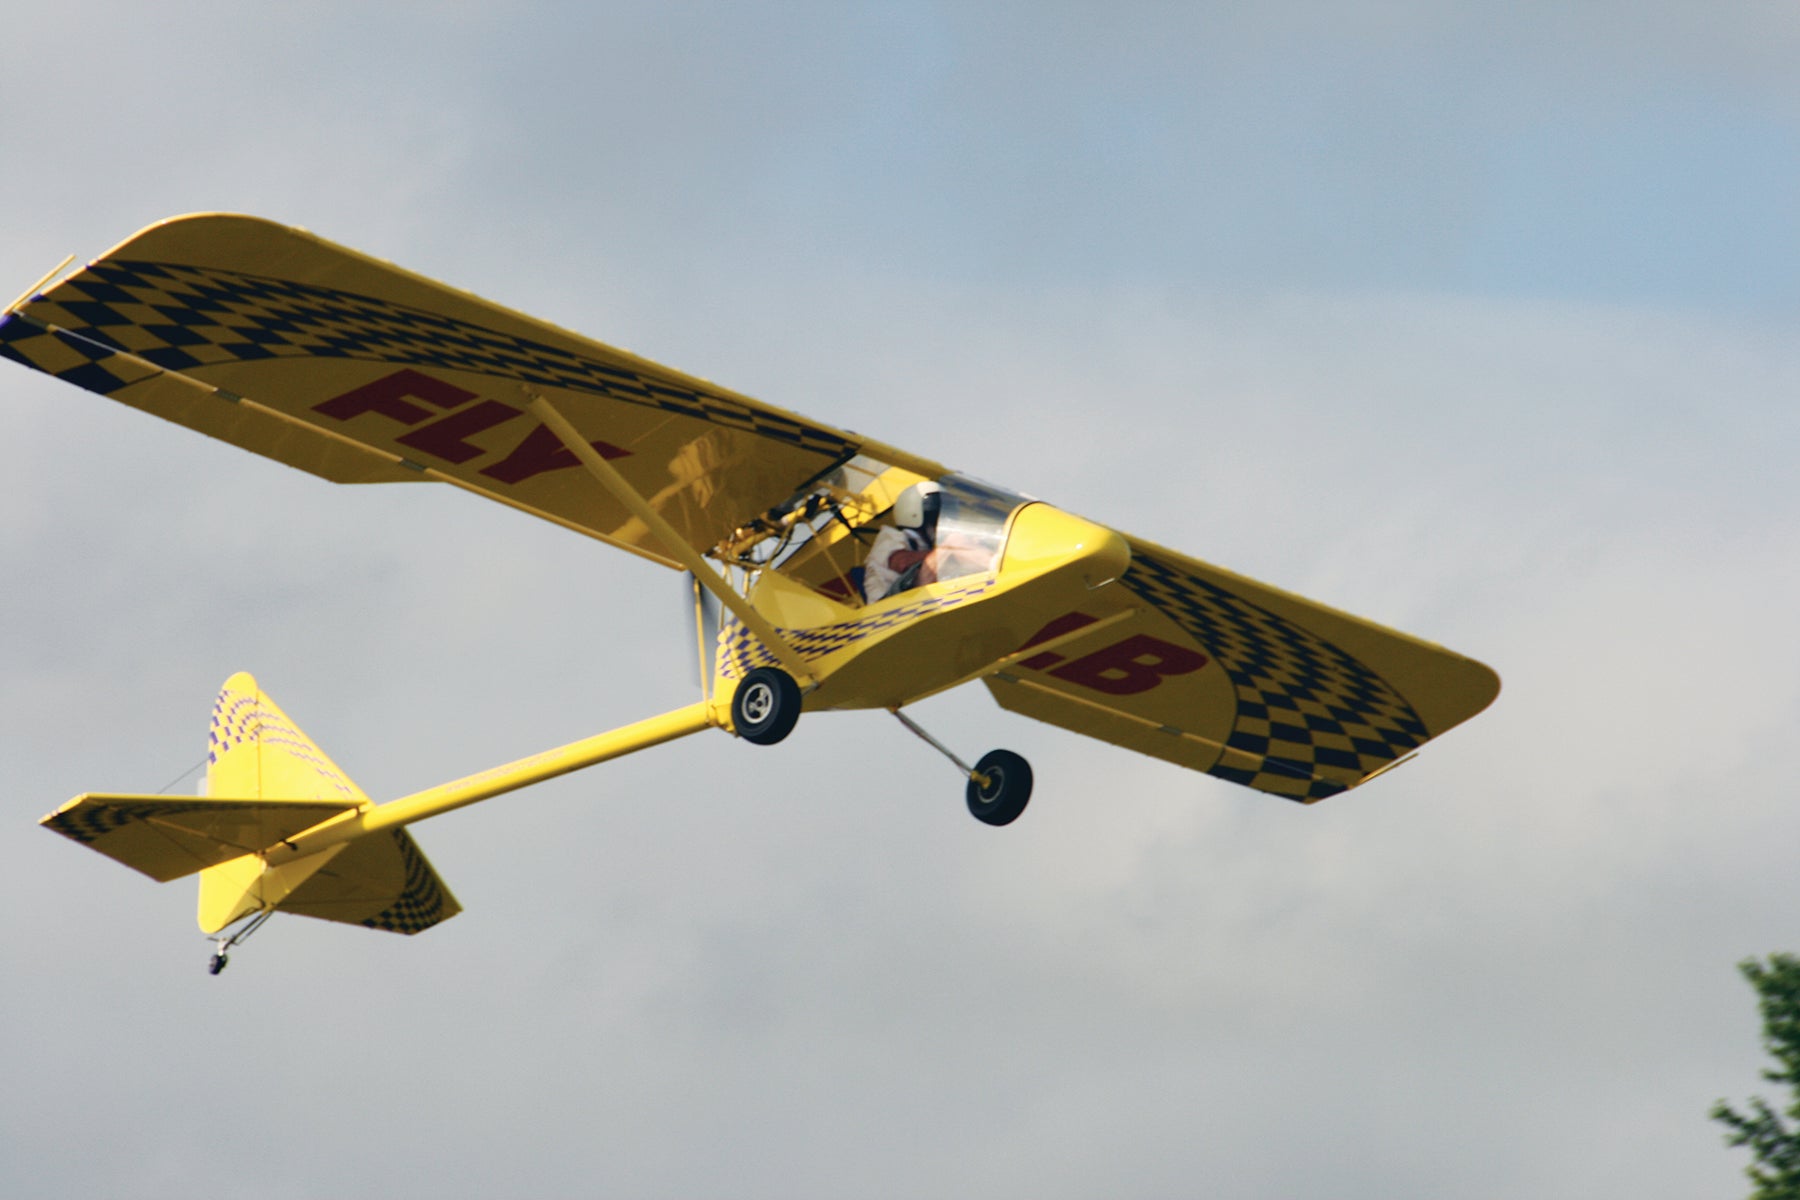
It was pleasant to find that the fatal accident rate for most homebuilts is proportionate and roughly equal to that of production GA aircraft. Ultralight-style homebuilts don’t offer as much protection, but the lack of surrounding structure is part of the appeal.
So why is the overall GA rate 18%, vs ~25% for homebuilts? Probably because nearly a third of the single-engined GA fleet are Cessnas: High winged, strut-braced, extremely modest performance airplanes that fly slower and protect the occupants better.
Being a better pilot certainly increases your chance of survival, but your decision-making has a disproportionate effect. As a group, homebuilt owners should really cut back on the low-altitude stuff and the scud running.
I feel like a bit of a hypocrite saying that—I was once young, foolish, and thought myself immortal. But I learned my lesson (without an accident), and have been on the righteous path for the past 30 years. Go thou and do likewise.
For more great content like this, subscribe to Kitplanes!