There are few things in airplanes as misunderstood and misused as the mixture control. Old Wives’ Tales (OWTs) abound, many of them spread by POHs, the FAA, and even the engine manufacturers! Not much of what you’ve read and heard about mixture management makes sense – much of it is out of context, and most of the good stuff is so dry, dull and boring that it’s tough to get through it without falling asleep.
I have flown with pilots who say, “Oh, I never lean, it’s just too complicated,and fuel is cheaper than an engine overhaul, anyway.” What really annoys me is that some of them even make TBO that way! What they don’t think about is how many problems they have enroute to TBO – fouled plugs, burned valves, cracked cylinder heads, etc. -and how much money they waste on fuel. Even worse, they don’t think about how much time they waste making unnecessary fuel stops. Yeah, yeah, I know, your bladder range is more limited than your fuel range. I’ve heard that before, but it sure sounds like a cop-out,to me.

Ever make an extra stop for “cheap fuel?” Do you feel smug when you buy fuel for ten cents a gallon less than usual? Why, then, do so many pilots fail to learn a little about their engines and save 20% or more on fuel used?That’s just like getting forty cents off per gallon, these days! What am I missing here?
Others will tell me, “I lean to 50°F rich of peak, just like the POH says,”not realizing that this can be – and often is – the very worst possible setting they can use!
Still others will decide on some arbitrary power setting with no particular logic in mind. 65% is a very common level. They’ll carefully set the MP and RPM to the book values for 65% and figure that’s all they have to do to attain that power setting. Wrong, it also takes a very careful mixture setting, as well!
Don’t be afraid of that red knob. Learn to use it! With a few pretty obvious exceptions there is nothing you can do with the mixture control over a short period of time that will hurt you or the engine. Used properly, you’ll save a lot of fuel, your engine will run cooler, cleaner, smoother, and longer, with less maintenance expense and downtime along the way to TBO.
There! Now that I’ve gotten all that off my chest, lets see if we can make a little sense of all this. If you haven’t read my previous columns on manifold pressure and props, this would be a good time to do so, as this is the third in a series and builds on those earlier efforts.
I’d like to first discuss some things about the fuel we use, then go rather deeply into the operation of a “perfect” engine. After that, I’ll offer a little history of why and how our engines are not perfect, and what we can do about it.
Pyromaniacal Prattling
If you’ve been to the movies, or watched TV in the last 30 years, you’ve undoubtedly seen the shot where someone pours a long trail of gasoline on the ground, then strikes a match and lights it off. If you watch closely enough, the flame is a fairly gentle one,and the flame front moves fairly slowly until it reaches whatever is going to explode, and then blows up – violently. A favorite shot is the car gas tank. While Hollywood plays tricks with physics now and then, this particular one doesn’t need much fakery: it’s quite real.
But why does the fuel burn so slowly as the fire snakes across the ground, and why does it blow up so violently when it reaches its intended destination? The short answer is “mixture.”
By itself, gasoline won’t even burn. Try dropping a lighted match on the tarmac and then pouring some liquid gasoline onto the flame: You’ll put the fire out. This is the “too rich to burn” case.
Returning to that movie scene, the trail of gasoline across the ground only burns because the gas is evaporating, changing into a vapor, and at some point above the surface the mixture will support combustion. That little bit of vapor burns, lighting off the next few molecules, which light off the next batch, and so on.
If we could closely examine what’s going on, the surface of the liquid fuel would not be burning at all, there would be a thin layer of very rich vapor just above it, also too rich to burn. At the point above the surface where combustion does take place, the fire burns “up,” and all the combustible mixture above that point also burns. Blow a gentle breeze across this process (“fan the flames”), injecting more air into the process (leaning it out) and you’ll see a much more vigorous flame, and a much faster flame front. Blow even more air, and there will be too much air (too lean), and the fire will slow down again, and ultimately go out.
Now, what happens when the burning trail of gasoline reaches its destination? If the fire hits a full gas tank, the fire will simply go out! The liquid is again too rich to burn. But if the tank is partially empty, there will be a nice volume of combustible gasoline vapor at just the right mixture in the upper part of the tank. The smallest spark is more than enough to light that off, and the flame front will expand rapidly in all directions. The rapidly expanding gasses will blow up the tank, scattering the liquid fuel, nicely mixing it with air, and creating an even larger volume of highly combustible fuel/air mixture. Technically, this is not an explosion: It’s still just burning. But it takes place so quickly that it appears to explode.
Another example. Propane (or acetylene, or any flammable gas), right out of the tank,makes a rather lazy, sooty yellow flame that really isn’t very hot, only a few hundred degrees. Add air to that mix, push it out that pipe under some pressure, and it turns into a hissing blue jet of flame at several thousand degrees. Your gas stove is cleverly designed so that the rising heat sucks air into the gas stream, making a mixture that burns with a nice hot blue flame. But mix too much air with that gas, and the flame becomes weaker, weaker, and finally dies out – the fire is burning so slowly it simply can’t leap from molecule to molecule. Well, at least that’s the way I like to think of it!
All this is a very good thing, because if any of these substances could burn on their own, the fire would run right back down the supply line to the tank, and burn it all – quickly!
It’s All in the Mixture
How does this translate into the gasoline-powered, spark-fired, internal combustion engines found in our airplanes (and also in tractors, lawn mowers, and cars)? For purposes of this article, I’ll limit my discussion to normally-aspirated engines, leaving turbocharged ones for a future column.
In the engine that powers my Bonanza (a TCM IO-550), if I flip the boost pump to high with the mixture rich, I can literally “flood” the engine and kill it, even at takeoff or climb power settings. (Update Oct. 2005: This column was written in 1999, when I believed that to be true. Alas, it is not completely so. At low power settings, it is true, and illustrates the principle nicely. But most of these engines — including mine — tolerate the boost pump very well at high power settings. Indeed, the boost pump can be your friend if taking off with hot fuel in the tanks, or if you climb rapidly, as with the Turbo’d aircraft.) Any malfunction that pumps “too much” fuel into the combustion chamber (relative to the air) will do the same thing. The fuel is flowing, the spark is sparking, and the airspeed is still turning the prop, but there’s just too much fuel and not enough air. Flip the boost to “Low” or “Off” or lean it out with the mixture control and the engine will run again. Given the correct fuel flow, air flow and spark, it must start and run.
An aside here. Two people report that when they have run a tank dry as I described in another column, they have had a minor problem re-starting. This may be a possible explanation if they shoved the mixture in and flipped the boost pump on at high altitude. The engine goes quickly from “no fuel” to “too rich to run” and can’t start. If you run into this problem, don’t change anything but the fuel selector, and maybe flip the boost on momentarily, just to get the fuel started again to the engine-driven pump, then turn it off again. That engine will start. After all, it is FAA-certified to do so!
At the other end of the spectrum, pulling the big red knob all the way back cuts off all fuel to the engine, making the mixture “too lean” and also causing the engine to quit. We do this to shut down the engine on most airplanes, so this is more familiar territory to most.
Fire in the Hole!
Somewhere in between those two extremes of “too rich to run” and “too lean to run,” there is a small range of mixture settings that will allow the engine to run. At each end of that small range, the engine doesn’t really run very well,but things get better in the middle of the range. It is this range of”burnable” mixture we need to understand. So, read on.
(This picture, and several others in this column comes from the superb Pratt & Whitney “The Aircraft Engine and its Operation”, February 1955 edition. I have arranged to have this publication duplicated, copies available for $60. 150 B&W pages, 38 in color. If you want a copy, drop me an e-note at jdeakin@avweb.com.)
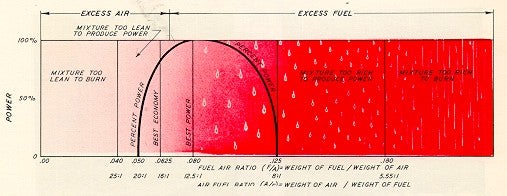
The chart above depicts only the lower end of the mixture range, from “no fuel” to about 20% fuel, by weight. Obviously, any mixture greater than 20% fuel is also “too rich to burn.”
Note also that only a very narrow part of this will actually support combustion at all, from roughly 5% to about 12.5%. Remember we’re talking here about weight of both air and fuel. At 20:1 by weight, the mix is 20 pounds of air, and 1 pound of fuel. By volume, that’s about 11,700 gallons of air for each gallon of fuel.
Let’s do a little thought experiment here. Assume you are in cruise at 10,000 feet,with wide-open throttle and the prop control set to 2,300 RPM. Now cut the mixture,shutting the engine down. The prop governor will attempt to maintain that 2,300 RPM, and for the purposes of this exercise, let’s assume it can, and does. Thus, even with the fuel cut off, the engine is still turning, the pistons are still pumping air, and you’ll still have the same manifold pressure (about 20 inches). All engine instruments will remain normal, except CHT and EGT which will drop pretty quickly. You establish a nice power-off descent with enough speed to keep the prop windmilling within the governing range. (This is a learning exercise, and not an engine-out drill, where you’d reduce to “best glide.”)
For most normally-aspirated engines, as you get down around 8,000 or 9,000 MSL, the resulting manifold pressure and RPM will be approximately correct for the classic 65% power setting. How much power are we getting? None, of course, or 0%. My point is that MP and RPM alone do not determine power output. Obviously, mixture plays a major part in the power equation, too!
Continuing our thought experiment, you’re at the extreme left end of this chart, all air and no fuel (“too lean to burn”). Now, start easing the mixture control in(moving to the right on the chart). At some point, that will begin to allow fuel into the air, but still, nothing happens until that “mix” gets to the 5% point. At about that point, the engine will start rather abruptly. If you look closely at that chart, the power curve rises just about vertically to around 30% of power, and only a tiny bit more fuel will bring it to 50% power. After that, it takes larger and larger increases in fuel to get to 100% of available power. Note there’s a fairly wide “flat spot” on top of that curve, where power stays pretty constant. Note also that if you enrich even further, power drops off again – ultimately, to zero (“flooded out”).
Adjusting the mixture level (by weight) to about 8% fuel will get the absolute maximum horsepower out of that fuel and air mixture, so we call that “Best Power Mixture.” No matter how you play with the mixture, that’s the best you can do for sheer, raw power. This setting is useful for maximum speed, maximum climb, and for converting gas into noise. This is “Maximum Power for the Fuel and Air available.”
Most of the cruise performance charts in General Aviation aircraft POHs either don’t mention it all, or there is a tiny note somewhere that the chart numbers are valid only with a mixture setting at “Best Power” (at the top of our power/mixture curve). This is often a marketing ploy, as faster airplanes sell better.
Now here’s a slippery concept for many (well, at least I had trouble with it). If were-lean the mixture a bit, say 10% (moving back to the left on the chart), the power doesn’t drop very much, perhaps only 5%. Hmm, think about that. 10% less fuel, 5% less power. This seems more efficient – and it is. We’re not getting the maximum horsepower,we’re getting a little less, but for a lot less fuel. (There are many things in aviation that work this way. Give a little here, get a lot there.) Tests have shown that at about 6.25% of fuel (by weight) we won’t get as much power (it’ll be roughly 80%), but we will get the most power per gallon, and we call this “Best Economy”.
To look at it another way, by running at “Best Power,” we are wasting a little fuel to increase the power.
In this context, when we speak of “power,” we’re speaking of the power available from a particular amount of air and fuel, and not some percentage of”rated power” from the engine. In other words, this mixture diagram applies whether we have half throttle and 1500 RPM, or any other setting. For any given setting of throttle and manifold pressure, this chart of combustible mixtures applies.
In fact, sitting on the ground, idling at 1,000 RPM, you can see this. The prop is well out of the governing range and at its flattest pitch. RPM is thus a direct indication of power. Full rich, flip the boost pump on, and you may flood the engine out completely. But quickly pull the mixture knob back to keep it running. With this setup, you can vary the mixture, and watch the results on the tachometer. Too rich, the RPM will be low, the exhaust will be sooty. Lean it, and you’ll come to an RPM peak. Keep leaning further and the RPM will drop again – eventually to zero. It gets very sensitive at the extremes, because of the steep slope of the curve on the combustion chart.
The mixture control is the most important “power control” we have! Using the mixture alone, we can vary the power from zero (lean) to “full,” and back to zero (rich). We can’t do that with the throttle (there’s always some power at idle) or with RPM (unless we can feather the engine.) Of course, for practical purposes, the real range of power control through mixture adjustment is from about 30% on the lean side, to 100%, and back to 30% on the rich side.
Interpreting the Gauges
For far too long, these engines have been run with no science at all. We simply haven’t had any decent instrumentation to tell us what’s going on in the combustion chamber. If you’ve read my previous columns on manifold pressure (MP) and props (RPM), you now realize that neither MP nor RPM is a very good indicator of power or what’s happening inside the engine. The story they tell is incomplete, because it ignores the profound effects of mixture.
If your airplane has the old-style Cylinder Head Temperature (CHT) instrument, it probably has a green arc (or line) to denote normal operating range, with a redline at the upper end, and maybe even no numeric temperature markings at all. The CHT probe is often not even on the hottest cylinder, or in a location that will yield useful information. The early single-probe Exhaust Gas Temperature (EGT) systems were little more than a good thought, because some only measured the EGT in a single cylinder, or an average of half the cylinders, or maybe an average of all the cylinders (depending on the probe location). What few realized is that because of a severe mixture maldistribution, these engines are nothing more than a collection of four or six separate one-cylinder engines, flying along in loose formation. A single EGT indication from one of them – or even an average of all of them – is virtually meaningless, because the others are certainly doing something very different from the one you’re watching.
In the big old radials, where we can often watch the exhaust at night, we can see directly what is happening. At full rich (takeoff and climb), the exhaust is a bright yellow, with visible flames licking (slowly, relatively speaking) back along the cowling. Lean it out, and the flame turns blue, becomes shorter, and burns more intensely(quicker). Keep on leaning, and it turns white with a noticeable loss in power. If you lean it far enough, the fire goes out and the engine quits. In the early days of the big radials, it was easy enough to learn how to lean the engine by sight at night, develop a”feel,” and duplicate it closely enough in the daytime. The design of the big radials also allowed a direct measurement of actual power being delivered to the prop, and this led to some very scientific leaning methods indeed, based on actual power. This “art” had become a real science towards the end of the heyday of the big radials- on DC-7s, Connies, and others – both in the airline world and in the military. By any accounting, there were several hundred million hours of accumulated experience on large fleets, under highly controlled and monitored conditions, by professional crews who had to operate in a very consistent and standard way, using some pretty sophisticated tools for those times.
Another wonderful feature of the radial engine is that the intake pipes are all the same size and shape, and they radiate from a central point. This gives a wonderfully even air distribution to all cylinders. In many of the radials, there is also a gear-driven supercharger at that central point, which is just a centrifugal impeller. The fuel is often sprayed into the airflow just before it gets to that impeller, resulting in a nice, even mixture. As a result, not only is the air distribution very good, but so is the fuel distribution.
We lost all that with the “flat fours” and “flat sixes” that power most GA aircraft today. There is no practical way of measuring power directly, the exhaust cannot normally be observed from the cockpit, and the mixture distribution is often dreadful as the engine is delivered from the factory. Intake pipes of the “log runner” type are of dramatically different lengths for different cylinders. Despite this, the actual air distribution is pretty good in the big-bore TCM engines. Most Lycoming engines, however, have a “plenum” type induction system that provides somewhat unbalanced air distribution that changes with engine RPM.
Many of these engines have terrible fuel distribution. The carbureted engines are the worst, but many fuel injected engines are not a lot better. (Fuel injection does have other benefits, however.) Again, what we really have is six (or four) cylinders flying along in loose formation, each doing their own thing with regard to mixture, while the pilot has only one mixture control, a “master mixture” if you will, which simply controls total fuel flow to all of them.
Here’s what that looks like in a typical TCM IO-520 or 550, with stock injectors, and all cylinders instrumented. Some engines are “better,” others are “worse.”
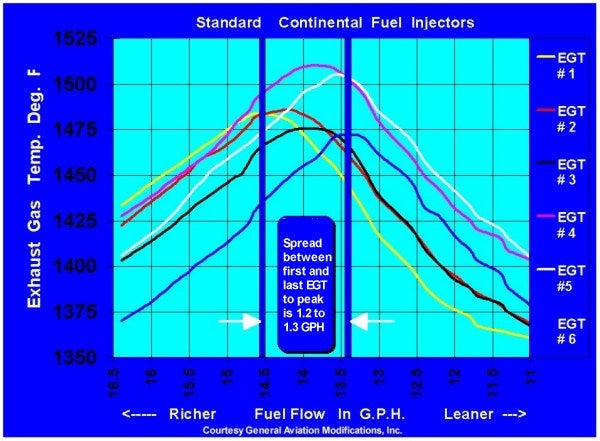
For simplicity, this chart shows only the six EGTs plotted against fuel flow. In this chart (unlike the previous one), “richer” is to the left,”leaner” to the right. If you start with “full rich” on the left side, and lean slowly, you will see all EGTs rise together at first. At about 14.5 GPH, the #1 cylinder peaks, and then starts cooling off on the lean side of peak. Very shortly thereafter, #2 does the same. (#1 and #2 are the rearmost cylinders in the big-bore TCM engines.) We continue leaning, and soon #3 and #4 (the middle cylinders) hit peak EGT and start down, while #5 and #6 continue rising. Finally, at about 13.3 GPH, the last cylinder peaks. But what has happened to number 1, the first cylinder to peak? It is now 40 degrees lean of peak (LOP)!
Understanding the Relationships
That relationship between “Best Power” and “Best Economy” is but one aspect of this subject. What is happening to the EGT while we lean? What is happening to the CHT? What is happening to the fuel consumption, and the power? More importantly, what is their relationship to each other?
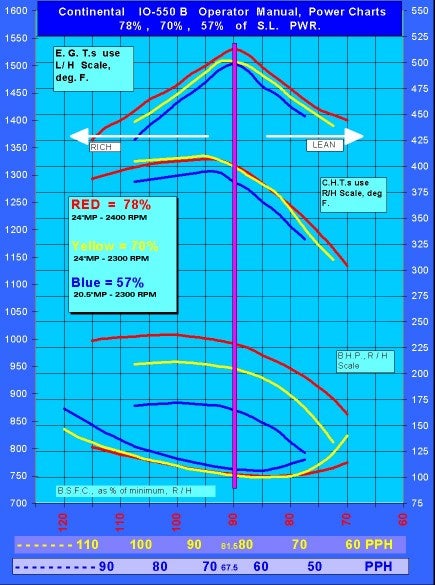
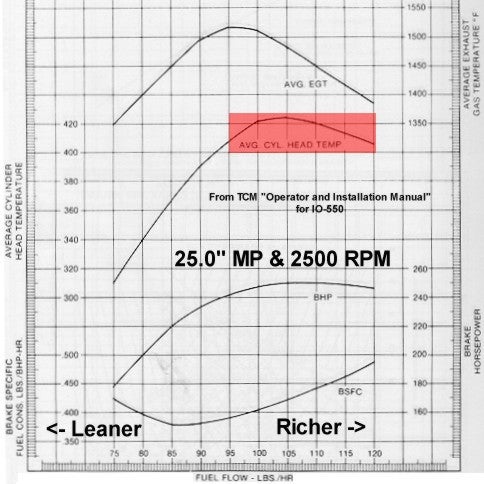
TCM, like Pratt & Whitney and Wright before them, publishes a neat little chart showing this. Some are surprised that the charts from these different engine manufacturers all look just like each other! When you think about it, this is not really that strange, because the principles are the same, the metallurgy is the same, the sparks occur at about the same time and the geometry of the pistons, rods, and crankshafts are the same, whether the engine is from a DC-7, a Bonanza, or a John Deere tractor. Here’s one such”relationship chart” from TCM:
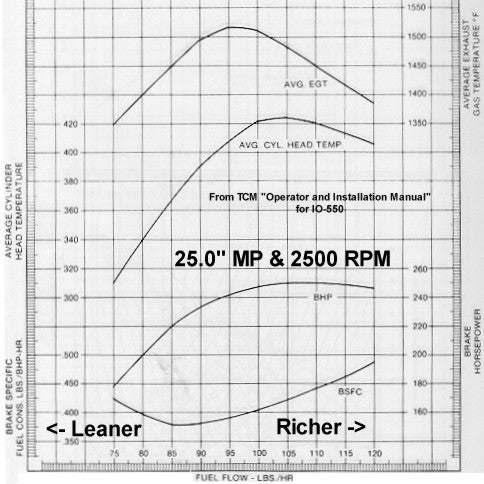
Now, please stop right here. DO NOT just skip over that chart, it’s important. It looks a little complicated, because there are four parameters on one chart, and each needs to be understood. If you are not prepared to understand that chart, I don’t think you can understand how to operate your engine properly, much less understand the rest of this column. Please take the time, right now, to follow me through on this chart!
The entire chart represents data while running at 25.0 inches of manifold pressure and 2,500 RPM. Those are held constant – only the mixture changes.
Please read the preceding paragraph again, it’s VERY important.
The only variable is the fuel flow, plotted across the bottom of the chart, and all four parameters are plotted against that fuel flow from 75 to 120 pounds per hour (PPH). This gives a lovely picture of the relationships. Note that “Richer” is again to the right on this chart (I could have swapped some of these charts left to right to make them all the same, but preferred to stick to “authentic.”)
The right side of the chart is not necessarily “Full Rich”. For whatever reasons, TCM chose to show just the range of fuel flows from 75 to 120 PPH on this IO-550, while “full rich” at sea level is about 162 PPH.
The top curve shows EGT, aligned with the numbers on the right side, from a low of 1,350°F at 75 PPH (lean), peaking at about 1,520°F at 95 PPH, and dropping again to 1,380°F at 120 PPH (rich). This is a classic EGT curve, and many of you will be familiar with it. There, now that’s not so bad, is it? And you thought this chart was too complicated!
Below that is the CHT curve, with the scale at the left. About 310°F at 75 PPH (lean), peaking at about 425°F at 105 PPH, dropping again to about 405°F at 120 PPH (rich). Note the CHT peaks at a substantially richer mixture than EGT. (In fact, you’ll see that the hottest CHT occurs at the point where EGT is about 50°F rich of peak (ROP). Hmmm, where have we heard that before?)
The third trace from the top is “brake horsepower” (BHP), which we can just call “Power” as delivered to the shaft. The numbers for this trace are on the right, and our trace shows 180 HP at 75 PPH (lean), peak at about 250 HP for fairly broad range of fuel flows, and drops only slightly to about 245 HP at 120 PPH (rich). Note that going all the way to “Full Rich” would produce a good deal more fuel flow and a good deal less power.
Finally, the bottom curve depicts “Brake Specific Fuel Consumption” (BSFC).This fancy-sounding engineering term is nothing more than the fuel required to produce one horsepower (HP) for one hour.
A useful trick to help you understand this chart is to lay a clear plastic ruler vertically on the chart. Keeping it vertically oriented, move it back and forth horizontally. As one end of the ruler moves over the fuel flow scale at the bottom of the page, the four curves will move up and down along the ruler’s straightedge, just as those parameters move up and down in the real world.
Remember earlier, where I said we could lean a lot and only lose a little power? Well,this curve gives us a visual idea of how that works. At 75 PPH (lean), it takes about 0.425 pounds to produce one HP for one hour. In the range 85 to 95 PPH, less fuel is required: about 0.385 pounds of fuel. Enrich further to 120 PPH, and you’ll be burning about 0.480 pounds of fuel to produce one HP for one hour. In this case, “less is better” if we’re looking for economy. BSFC is a very useful term, as it is a direct indication of an engine’s efficiency. Modern automobile engines, contrary to popular belief, are not very efficient, having BSFCs above 0.42 or so. They are designed to run very clean, however, and sacrifice some efficiency as a result. TCM engines can achieve BSFCs as low as 0.385 from the factory. With modifications, we’re going to do better than that. Not too shabby for “World War II technology,” as so many call it!
Now, here’s the crucial concept behind this chart: All four curves are carefully plotted with reference to the fuel flow scale at the bottom, and this gives us a lovely opportunity to look at the relationships between them! If you’d like to know what is happening to CHT as you fiddle with EGT, the answer is here.
For example, let’s say we’ve leveled off in cruise, allowed things to settle down and it’s time to lean, at whatever MP and RPM you choose. Starting from full rich (perhaps well off the right side of this chart and due to the enrichment feature at full throttle), we start leaning. According to the chart, the EGT and CHT will rise, and we know this to be true from experience. The power rises only slightly. If you’re going for absolute maximum altitude or speed, that very flat “peak” in the BHP curve that occurs around 105 to 110 PPH fuel flow will be helpful, and if you’re making a high-altitude takeoff, it will be very helpful. The BSFC is dropping as you lean, of course,you’re getting “more efficient.”
So as the mixture is leaned, power peaks first, with CHT peaking at very close to the same point. In practical terms, if we lean to max CHT, we’ll have max power for that MP/RPM setting. Doesn’t that make sense, intuitively? Max power, max CHT? It’s not precisely true, but it’s close enough.
Okay, so power peaks first, stays pretty flat, and then CHT peaks shortly thereafter.With continued leaning, power and CHT drop together – very gradually at first, then progressively more steeply – while BSFC continues to improve and EGT continues to rise.
Continue leaning, and EGT peaks and begins to fall, while BSFC continues to improve.Sure, we’re losing power, but fuel consumption is declining even faster, so our”economy” (as measured by BSFC) is still getting better.
Finally, BSFC bottoms out (at “best economy mixture”), and stays pretty flat between 85 and 90 PPH. If we disregard the small difference between 0.385 and 0.400, we could even stretch the point a little, and say the BFSC curve is “kinda flat” between 85 and 100 PPH. Look immediately above at the HP curve, and note that for a small loss of fuel efficiency, we can pick up 25 to 30 HP? Isn’t that interesting? We’ll see later how that affects airplane performance and efficiency, a very different subject. But to make a long story short, if the power setting that results from optimizing engine efficiency causes your airplane drop below the airspeed range that provides optimum aerodynamic efficiency, you’re not gaining anything! That’s a whole ‘nother can o’ worms. (I feel another column coming on.)
But What If We Change MP or RPM?
Let’s say we have carefully set up a real 65% of rated power, using the required MP/RPM, with the mixture leaned to Best Power.
What would happen to this if we increased the MP and/or RPM, keeping the mixture constant at Best Power? More power to the shaft, right? Think about what this might do to that chart. Since the power moves up, all the curves must move up. Since the peak EGT will occur at a higher fuel flow, it must move to the right, and all the other traces will move right, too, to preserve the interrelationships.
Here’s what that looks like:
Note the left-right relationships don’t change on this chart, because we’ve fiddled the fuel flow scale at the bottom to keep them aligned.
Heads up, crucial concept coming! Assume that we increase MP to increase power output to something substantially above 65% power. Now suppose we lean the mixture a bit, until the actual power drops to exactly 65% power again?
Here’s exactly what that looks like:
This is a real picture of a Cessna 414, previously trimmed up very carefully for straight and level flight at equal MP, RPM, and mixture settings. After that, the throttle is increased, and the mixture decreased, to produce what you see here, with no tendency to yaw/roll/turn. This situation is actually very sensitive to very small differences in power.
Remember, both engines are producing exactly the same power!
The left MP is 3″ higher than the right, but the left fuel flow is 3.2 GPH lower! Note further, the EGT is only 10°F higher, but the CHT (as shown by the missing bars on the Graphic Engine Monitor display) are 1 to 3 bars lower, with each bar representing 25°F.
Ponder this: cooler CHTs, less fuel, same power. Sounds like magic, doesn’t it? Why, if we could run that MP up high enough, and pull the mixture back far enough, we might invent perpetual motion! Unfortunately, this is another aviation case where a little is good, but “more” isn’t. There are other forces at work.
Geometry and Physics into the Fray
Just as there is a right time to make your move on that blonde across the room, there is a right time to “light the fire” in the cylinder. (In my experience, the latter is far more easily determined than the former.) Intuitively, you would think it a simple matter, just light it off when the piston hits TDC (Top Dead Center). But the fact is, it takes quite a bit of time to light that fire, and for the flame front to propagate sufficiently to do anything useful. The fuel/air mixture nearest the spark plug must be in the combustible range, and the fuel molecules must be close enough together to continue the process. Even under the best of circumstances, combustion is still something of a random process, so there is a variation from cycle to cycle in the same cylinder. But for the most part, the molecules cooperate with great glee, flinging themselves into the fire in order to do useful work, even if that’s only to transport us to the site of a $100 hamburger.
The best time to “light the fire” also changes with RPM and mixture. At a high RPM, it takes a short amount of time for the piston to rise and fall. At a slower RPM, it takes longer. But the flame doesn’t know anything about pistons rising and falling (or crankshafts turning), it’s still burning at the same speed. (Well, almost.) This can change the point at which useful work is done quite dramatically. When, then, should we “light the fire?”
The answer depends on all three engine parameters – mixture, RPM and MP – so ideally our ignition timing would be adjusted accordingly. Some of the big radials do in fact have variable spark settings, but the flat engines most of us fly behind are stuck with fixed timing. (But “Stand by for NEWS!”) Since maximum power is the most critical case, ignition timing is typically set to be optimum at full takeoff power, and operation at lower power settings is something of a compromise.
At maximum power, long experience has shown that discharging the spark at 20° to 25° before top dead center (TDC) is about right. That much ” lead time” gives the fuel/air charge time enough to develop a good fire, and the pressure will start to build just as the piston reaches the top-of-stroke. From that point, the fire gets really serious, and the pressure builds rapidly, just as the piston starts falling away.
Again, through long experience and actual measurement, it is clear that about 16° to 18° after TDC is the best place for that pressure peak to occur, in order to extract the maximum amount of useful work, as shown by the following picture from the Pratt & Whitney book:
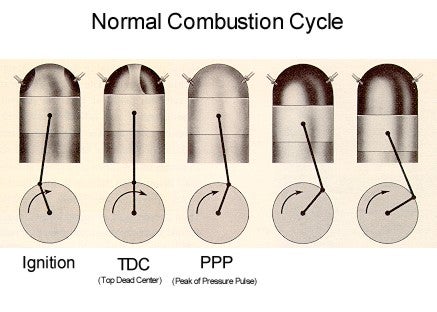
As you can see in the first picture, when ignition occurs the crankshaft knuckle is reaching the top of its arc, which also puts the piston very close to the top of its stroke. At first glance, igniting the charge at 22° before TDC seems like it would be counterproductive, since the piston is still coming up. However, in reality, it takes sometime for the fire to get going, and by the time that happens, the piston is already pretty much topped out, so the building pressure cannot really produce the “negative power” you might have expected at this point.
The second picture shows perfect TDC. No matter what the pressure in the combustion chamber is doing, there is no “mechanical advantage”, no leverage, as the piston is just pushing straight down on the connecting rod, which is pushing straight down on the crankshaft throw. Combustion chamber pressure at this point produces no useful work at all (but it sure loads the bearings.)
The third picture shows the approximate position of the assembly at the peak pressure point (PPP). If the pressure peaked a little sooner the piston would be at the top of its travel, with less mechanical advantage on the crankshaft, and engine stresses would get very, very high. At about 16° after TDC, some decent mechanical advantage is just beginning to take place, and that allows time for the rest of the combustion event to”push” the piston down. If the peak of the pressure pulse occurs much later than 16°, the initial peak would have a greater mechanical advantage, but then much of the energy in the later stages of the combustion event would be lost. On balance, a PPP at 16° after TDC turns out to be about the best you can do. Another compromise.
At very high power settings (such as takeoff power), we’ve found that throwing extra fuel into the mixture (providing an enriched mixture at the rich side of the flat peak of the BHP curve) helps keep temperatures down and allows us to develop even more power without the risk of detonation. This is why many engines have a “power enrichment” feature at full throttle. We’re willing to waste some fuel for a worthy cause during takeoff, especially since we usually don’t run at that high power for long. What would happen if we got all the way up to this very high power, and then pulled the RPM back? (Don’t try this at home, folks!) Well, with the spark occurring at 22° before TDC and PPP occurring at 16° after TDC at full RPM, there is a very precise timeinterval between spark and PPP. The crankshaft rotation is 38° (22° + 16°). If wereduce the RPM by 20%, the crankshaft will turn only 30° (80% of 38°) by the time PPP occurs, so now the peak pressure will occur at only 8° past TDC.
The preceding analysis is actually a bit of an oversimplification. In reality, there are other factors at work such as the rate of compression at the slower crank speed, so the relationship between RPM and PPP timing isn’t really linear. In this case, the PPP would probably occur more like 12° after TDC.
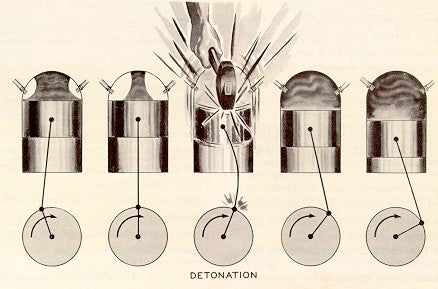
In any case, at maximum MP and reduced RPM, the peak pressure will be much higher, because the combustion chamber will be much smaller when PPP occurs. Since the pressure will be much higher, the temperature will be much higher, and this increases the risk of detonation. More on this later, but here’s the same picture, this time illustrating classic detonation:
This is the reason for the old rule of thumb, “Always reduce manifold pressure before reducing RPM, and increase RPM before increasing manifold pressure.”
This is not a bad rule, and it never hurts to do it this way. But you should understand that it really only applies in the high-power case where the engine is operating at maximum combustion pressures and temperatures, and detonation is therefore a possibility! If you’re cruising at 22″ and 2,100, and want to increase to 24″ and 2,400, it doesn’t really matter which control you adjust first, you won’t hurt a thing. Sure, as a matter of habit, run the RPM up, then do the MP. But the engine isn’t going to blow up if you do it the “wrong” way.
What about mixture at very high power settings? Remember, the engine manufacturer has optimized everything to produce all that power, and many parameters will be running within very narrow tolerances. Remember also the opening of this column, where I mention how much difference mixture makes in the speed of combustion. At takeoff power, if we bring the mixture control back a bit from full rich, the rate of combustion speeds up, and puts that pressure pulse closer to TDC. Again, a very bad thing. (Combustion speed reaches maximum around 50°F to 75°F rich of peak EGT, and further leaning causes it to slow down again.)
Our POHs instruct us to use full-rich for takeoff. The extraordinarily rich mixture is required to assure that detonation does not occur. The conventional wisdom is that the purpose of the “excess” fuel is to cool the engine, but in fact its primary purpose is to slow the combustion rate and delay the PPP, which eliminates the risk of detonation by reducing the pressure peak. This does, in fact, result in cooler operation, but that’s actually a second-order effect of the delayed PPP. (If we could just retard the ignition timing for takeoff, we wouldn’t need to throw all that extra fuel at the problem.)
Here’s what Pratt & Whitney thought a combustion event looked like, back in 1948:
Note how the pressure rises gradually to the point at which the spark occurs. It then rises very rapidly as the piston comes up to TDC, and continues to rise thereafter, mostly because the piston hasn’t dropped very far, due to the geometry of the piston rod, and crankshaft throw. Wouldn’t it be lovely if we could keep that same pressure on the piston,all the way down? We can wish, can’t we?
I don’t know how Pratt & Whitney got that picture, but it’s certainly pretty good,because here’s the real picture, as measured by the latest state-of-the-art digital instrumentation at General Aviation Modifications, Inc. (GAMI) in Ada, Oklahoma:
|
Looking Inside The Cylinder You need to understand a little about how GAMI gathers this data to appreciate the quality of what you’re seeing. They use in-house proprietary software, hardware, and test equipment to gather this data in ways that have never been done before. Driven by George Braly (rumors of whips and chains and piteous cries late in the night from converted tornado shelters abound) GAMI has developed a portable 128-channel data acquisition system that can be installed and operated in a Bonanza. It is entirely independent, with its own power source. Data can be captured to a laptop computer’s hard disk for later processing, and can also be displayed in real time, up to 50,000 samples per second (all channels). Using specially-modified sensors, GAMI can capture real time data from the ignition system, crankshaft angle, fuel flow, a large array of temperatures (including several points around an individual cylinder), and anything else that can be sensed. Most amazing of all to me is that this system can record actual instantaneous pressures within the combustion chamber at those same data rates! GAMI accomplishes this little trick by drilling a tiny hole down inside the barrel of the spark plug, and inserting a proprietary sensor that can measure pressure very accurately and at very high sample rates, sufficient to record every detail of the combustion event in real time. For the first time, we can have a look right inside the very heart of an operating engine, and watch and record what happens when we change anything. | ||
|
Looking Inside The Cylinder You need to understand a little about how GAMI gathers this data to appreciate the quality of what you’re seeing. They use in-house proprietary software, hardware, and test equipment to gather this data in ways that have never been done before. Driven by George Braly (rumors of whips and chains and piteous cries late in the night from converted tornado shelters abound) GAMI has developed a portable 128-channel data acquisition system that can be installed and operated in a Bonanza. It is entirely independent, with its own power source. Data can be captured to a laptop computer’s hard disk for later processing, and can also be displayed in real time, up to 50,000 samples per second (all channels). Using specially-modified sensors, GAMI can capture real time data from the ignition system, crankshaft angle, fuel flow, a large array of temperatures (including several points around an individual cylinder), and anything else that can be sensed. Most amazing of all to me is that this system can record actual instantaneous pressures within the combustion chamber at those same data rates! GAMI accomplishes this little trick by drilling a tiny hole down inside the barrel of the spark plug, and inserting a proprietary sensor that can measure pressure very accurately and at very high sample rates, sufficient to record every detail of the combustion event in real time. For the first time, we can have a look right inside the very heart of an operating engine, and watch and record what happens when we change anything. |
The lowermost (blue) line is the result of simply spinning the engine at 2,700 RPM with no combustion going on at all. As you might expect, the pressure rises and falls directly with the piston travel, reaching a maximum at TDC. It is perfectly symmetrical on both sides of TDC, and rises only to about 350 PSI at TDC.
The next line up (green) is a normal combustion event. Notice the pressure rises almost identically with the blue line, even after the spark, until the point at which the rise in the blue line starts to level off. It is at this point that the “fire” has truly lit off, and begins to increase the pressure on its own. This one peaks at about 18° after TDC (the “PPP” or “Peak Pressure Pulse”) at about 800 PSI, after which the pressure drops off gradually, but still producing a lot of downwards force on the piston.
Finally, the yellow line shows what detonation looks like. This is an abnormal condition. Note this is “mild detonation,” not really “the real thing” that can literally reduce an engine to an expensive pile of junk in a matter of seconds. It was deliberately induced by redline CHT and excessive MP (from a turbocharger). Note very carefully how early this builds and peaks, relative to a normal event. The actual raw data shows it occurring at about 8° after TDC, and the test engine did not sound like a happy camper! I’ve heard it, and it was ugly!
But let us get away from the unpleasantness of detonation, and look at a much more interesting plot of a power pulse, at a fairly high power setting (80%):
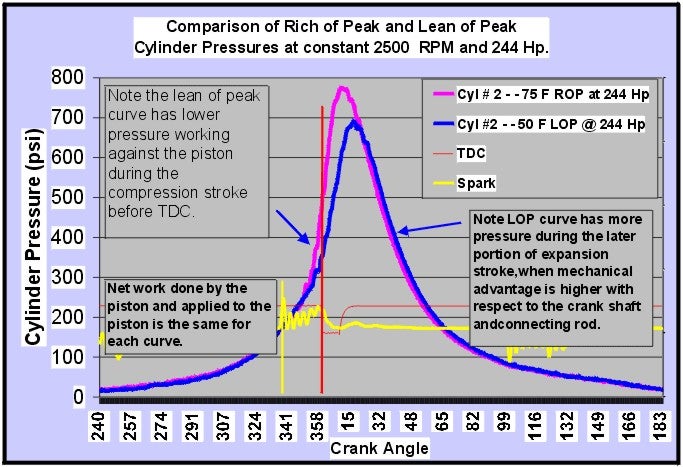 Those two individual charts are pretty self-explanatory, thanks to the efforts of George Braly of GAMI, who prepared them for me. The one on the left does NOT represent a”desirable” power setting. The RPM and the mixture are such that the peak pressure occurs only 10.8° after TDC, and this will produce very high CHTs.
The one on the right is far better, even though the MP is much higher! The peak pressure is out at 16.2° after TDC. Fuel consumption is way down, and so is the CHT.
The third plot simply overlays the previous two. Same day, same engine, same flight,measurements taken within moments of each other. Both are at 244 horsepower (81%!), both at 2500 RPM, both show the same cylinder, on a turbonormalized TCM IO-550.
How can we tell that the actual power developed is the same for the two traces? Well,as a rough check, the airspeed produced was identical. But using numerical integration,the area beneath each trace can be calculated, and since the area beneath the pink trace is the same as the area beneath the blue trace, we know the power is the same. Additionally, by knowing the pressure, the RPM, and other factors, the horsepower can be calculated quite accurately.
In effect, what happens is a longer, slower, more gentle, and later “push.” This shifts the mechanical advantage to a slightly better position,where a small change in angles makes a huge difference in effect.
Which combination is “better” to produce 244 HP? Well, the blue trace has a much higher manifold pressure, but CHT is about 35°F cooler. With cooler CHTs and lower peak pressure in the cylinder, which do you think is better?
How about CHT, Anyway?
CHT can be measured by a thermocouple washer under a spark plug, or by a probe screwed into a threaded boss in the cylinder head casting. The latter is probably more accurate. But there are wide temperature variations at different points around the circumference of the cylinder barrel, with some poorly-baffled cylinders showing up to 150°F difference between the hottest and coolest points! Poor baffling will also show up in large variations between cylinders.
But we’ve got to start somewhere, and again, the old manuals reflect a great deal of experience:
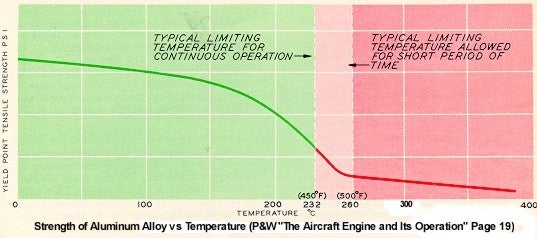
This chart from the Pratt & Whitney “The Aircraft Engine” shows what happens to aluminum alloy used in the cylinder heads and pistons of our engines. This is a scary chart, because it’s obvious that even at normal operating temperatures, we’ve already given up a substantial amount of strength. The redline CHT on my IO-550 is 460°F, well out in the “short period of time” area. I would prefer to stay out of that region entirely, and looking at the sharp gain in strength going from 450°F to 392°F (200°C), I think the conservative pilot ought to limit CHT to that 200°C value, as much as possible.
There is some support for this. The P&W book goes on to say:
|
“The higher limiting temperature (500°F) is for a restricted period of time, and is confined to take-off, to maximum performance in climb and level flight, and emergencies. The temperature limit for restricted operations should, therefore, be used for the shortest possible time only, and must never be exceeded. “The lower limiting temperature (450°F) is the maximum for continuous operation. It should never be exceeded except under the restricted operating conditions mentioned in the previous paragraph. It is sound practice to hold the cylinder head temperature 50°F (30°C) below this limit to keep the cylinder head materials at high operating strength.” [emphasis mine.] |
That puts us squarely at 400°F, a nice, easy-to-remember number.
There is more. GAMI has cemented thermocouples down in between the fins of a cylinder, tight against the barrel at the bottom of the grooves. While flying this at various temperatures, it was obvious that there is a variation around the circumference, even on a properly baffled and cowled engine. Furthermore, upon getting up around 420°F (at the probe), the CHT tends to become unstable, and tries to increase all out of proportion to whatever is going on. It seems pretty clear that at higher temperatures, the cylinder barrel goes significantly out-of-round, and since the piston can’t change shape to fit, the piston starts scuffing the narrow part of the resulting oval, leading to the rapid rise in CHT. I have tried this on my engine, and the same “thermal runaway” seems to occur. I stopped it long before reaching much over 440°F, so I don’t know how high it will go, nor do I wish to find out. By the way, the standard factory CHT instrument didn’t show anything abnormal at all!
Personally, I have my JPI set to warn me if any cylinder goes over 400°F, and I try to maintain 380°F as a maximum to provide a margin. TCM suggests limiting normal cruise temperatures to 380°F in one publication, but then in another they suggest 420°F. Go figure. I’ll take the lower value.
Let’s re-visit that TCM chart of basic engine curves, this time with a red area to correspond to the above:
Remember that this is the chart of operating parameters at 25″ and 2,500 RPM. Does that setting sound somehow familiar? Yes, it’s the setting many have used for years right after takeoff, for climb power! The high temperatures are the direct result of pulling the MP back to 25″, which cuts out the power enrichment feature of the fuel controller, leaning the engine dramatically!
This practice (pulling the throttle back after takeoff) may be the single most damaging thing many people do – with the best of intentions, to “make it easier on theengine!” Forget it, folks. Leave that throttle fully in, unless you need to make a substantial reduction in MP, maybe to 22″, or so. (Remember, we’re talking about normally-aspirated engines here.)
Let’s take a little different look at those TCM curves:
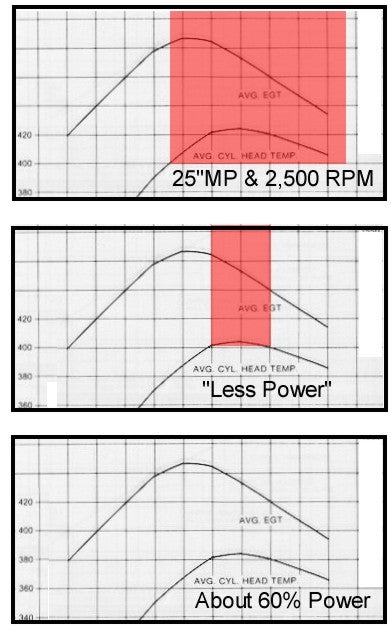
The top picture is the same one we just looked at. I’ve cut out a lot of extraneous detail to illustrate my point. If we consider that area of CHT “off limits”because it’s over 400°F, then the same area of EGT is also “off limits”because they go together. In this illustration, note there is no possible combination that will give us what we want, except very lean of peak, which would cost us a lot of power.
In the second picture, I’ve fiddled the CHT numbers, and erased the EGT numbers, to give a simple picture of some “Less Power.” It’s probably up in the 70% range, but that’s not what I’m trying to show. Look at the much-narrower red band covering the peak CHT (be very careful to read “CHT” and “EGT” correctly, here in this text, and keep them straight while looking at the picture.) Now run up to the equivalent range on the EGT, and note where it lies on the curve? At this still-high power setting, peak EGT produces a satisfactory CHT! From this we should realize that “The Danger Zone” on the EGT is mostly on the rich side of peak – precisely where many factory documents would have us run. At higher power settings, we need to avoid peak CHT, which means avoiding some area rich of peak EGT.
That Loose Formation, Again
Remember I talked about six (or four) cylinders, flying along in loose formation, all at different power settings? Now you may be getting the idea why I think that’s important. No matter where you set your mixture on such a beast, most of the cylinders are not running where you think you set them! You have set one cylinder, and one only.
Now suppose you lean by the classic advice “lean ’till roughness occurs, then enrich just enough to restore smoothness.” No one wants to run a rough engine, so this is good advice. A rough engine causes metal fatigue, pilot fatigue, sterility,baldness, imp…but, I digress. I think we can all agree that vibration is a bad thing, all around. What’s causing that vibration? Aha, I see that hand in back there in the audience. What’s that you say? “Lean misfire?”
Sorry Charlie, no tuna. There’s essentially no such thing as “lean misfire.” It’s probably a term some tech rep made up because he didn’t know the right answer. A properly set up engine will tolerate leaning and remain smooth right down to that 30% power range (see combustion chart), at which point it just quits cold. There’s no reason to shake, at all. Now that said, the real world is not perfect, and even well-set-up engines will show a just a tiny bit of roughness when leaned to the extreme.
What does happen to cause that roughness is that the first cylinder to peak and start down on the lean side will produce less power than the others, and unequal power from one cylinder (or more) will cause enough vibration to be obvious. So you enrich until the vibration goes away, restoring that one cylinder (or more) to approximately the same actual power as the others. That gets them all up on the “sort of flat” part of the power curve (see chart). There’s no way of telling just where all that occurred, or what cylinder it was, but the resulting chart might look something like this, with a new red area added.

This second and much more serious red area holds true through the entire spectrum of power settings, so it is much more serious. Virtually all factory big bore engines suffer from this uneven power distribution, which sets an artificial limit on just how lean we can run. Uneven mixture distribution causes the entire lean-of-peak-EGT region to become a red zone, not available for use!
Some Old Wives’ Tales (OWTs)
From this comes a few pernicious OWTs, all with a modicum of truth.
“Never run lean of peak!” That’s right, you can’t in most flat engines, because their uneven mixture distribution causes them to run too rough.
“Leaner is hotter!” That’s true only up to the point of maximum CHT, which occurs at around 35°F to 50°F ROP for most engines. Leaning beyond that point makes ’em run cooler. Naturally, if your engine gets the shakes at lean mixtures because of poor mixture distribution and the resulting uneven cylinder-to-cylinder power, then the only leaning range left to you is on the rich side, and if limited to that area, leaner is hotter!
“Leaning too much will burn your valves!” True (at higher powers), unless you continue leaning to the lean side of peak EGT (where leaning makes cylinder heads and valves run cooler), or you operate at sufficiently low power settings that valve temperatures remain acceptably cool even at peak EGT. (This works out to around 60% to 65% of rated power, on most of the flat “big bores”.)
These are the kinds of things running through factory tech reps’ minds when they scream (as a Lycoming rep did to me awhile back), “I wouldn’t recommend lean-of-peak to my worst enemy!” Neither would I, in his stock engine with its lousy mixture distribution!
There are, however, some alternatives.
What Do We Do about It; What Do We Do?
First, if you’re going to operate one of these expensive big-bore engines properly, you must install an all-cylinder engine monitor, which at least tells you the CHT and EGT in each cylinder. If I had a four-banger, I’d put one in it, too, but that’s more for troubleshooting. While I am disgusted at the stupid trademark infringement lawsuit that the owner of J. P. Instruments (JPI) has initiated recently, I am forced to concede that JPI makes a superior engine monitor, in my opinion. Insight also makes a good one that will do the job. I have not yet seen the new Electronics International monitor, shown at Sun ‘n Fun this year, but it looks great on paper. Any of these probe-per-cylinder systems with bar-graph displays will do the job.
Once you have that all-cylinder monitor, limit the hottest CHT to 400°F at all times. If it goes over that, increase airspeed (VERY effective!), open the cowl flaps a bit (if you have cowl flaps), or enrich the mixture if it is on the rich side (lean it more, if on the lean side). But using extra fuel as a coolant should be your last-resort solution after the other things have been tried and fallen short.
So far, most of this column has been discussing The Ideal Engine. Unfortunately, that doesn’t quite exist, yet, and those with carbureted engines are really left out in the cold, except for the above two tips (engine monitor and 400°F CHT limit.)
Here’s another tip for carbureted engines, if you’re operating high enough to use full throttle, or nearly so. From the full-throttle position, pull the throttle back until you observe the slightest drop in MP – perhaps a quarter-inch or less. Leave it there. That will cock the throttle plate a little, just enough to set up a vortex that will cause better atomization and mixing of the fuel and air. (This is counterproductive in fuel injected engines.)
In principle, we should all operate at the lowest possible RPM allowable for the MP, and the following TCM chart shows why.

As you can see, the losses to friction are about 37 HP at 2,500 RPM, and about 27 HP at 2,100 RPM. That’s 10 very useful HP, in my opinion.
However, this low RPM stuff must be tempered a little bit, by the fact that decreasing RPM moves the PPP closer to TDC. Anytime we move that PPP away from that ideal 16 to 18 after TDC, we’re losing power, and increasing CHT. On the other hand, the leaner we run the engine, the more we delay the PPP, getting it further from TDC.
From this we can see that there must be a balance between slower/leaner, and faster/richer. For high power, maximum-performance operation, you should run richer mixtures and higher RPMs. For low power, maximum-efficiency operation, you should run leaner mixtures and lower RPMs. It would be really nice if we could develop some sort of “super linkage” that ties the prop control and mixture control together into sort of a single-lever power control, but that would be a formidable design task. It appears to me that running in accordance with the POH will provide good results in the worst possible cases, and TCM probably felt this was their best option.
Fuel-Injected Big Bores
With big-bore fuel-injected engines like TCM 520s/550s and Lyc 540s, we’re getting some modern developments that can be of major benefit, and which will pay for themselves in short order. These improvements should also allow safe and efficient operation well outside the suggestions in the various POHs and manufacturers manuals, including much lower RPM, higher MP, and leaner mixtures. At low altitudes, I am routinely running my IO-550 at 2,100 RPM, full throttle, and very lean, perhaps 50°F LOP EGT. That produces about 75% of rated power. The engine appears to love it, runs very cool, makes much less noise, and runs very smooth. However, those settings would be a deadly combination if I enriched the mixture, or even worse, tried running ROP. I also cannot climb at that power setting, because the loss in airspeed causes too much increase in CHT.
Once you have the all-cylinder engine monitor installed, the next best thing you can do for your big-bore flat six is to install GAMIjectorsTM from General Aviation Modifications, Inc., in Ada, Oklahoma.
The usual disclaimer: I own no stock, directly or indirectly in GAMI. I wish I did. I do not work for them. I wish I did. I do not benefit in any way from the sales of their products, and I paid full-boat retail for my own GAMIjectorsTM. The owners have become personal friends, and are men that I admire greatly. I have been very distantly involved with them in some very minor testing and comment.
GAMIjectorsTM are custom injectors that match the fuel flows to the air flows in all cylinders. With these, you can quite easily lean your engine right down to starvation levels without roughness. This means you cannot use the old trick of “lean ’till rough, enrich ’till smooth” because the engine never gets rough at any mixture setting. Your engine will run cleaner, cooler, and smoother, and you will be able to use the full range of mixtures, just as the operators of the big old radials did for several hundred million hours in a bygone era. Oh, by the way, there is no evidence whatsoever to support the OWT that lean mixtures cause corrosion in exhaust stacks.
When you lean an engine with GAMIjectorsTM, you will see all EGTs rise at the same time. (The absolute temperatures may be different from one cylinder to the next, but that’s unimportant.) All should peak at the same time, and all should fall at the same time. This will produce results as in the following chart:
By this simple, one-hour installation, we bring our current engines up to very nearly the standards of “The Ideal Engine” I have discussed at length above.
Going well beyond that, GAMI is currently deep in R&D running test engines.This effort promises to give us all a better ignition system. No, not the junky current “state of the art” automotive style electronic ignition systems for our aircraft, but a simple, safe, certified system that will leapfrog all existing technology. For the first time, there will be a system that fully controls what is happening inside the combustion chamber.
I haven’t seen this experimental system run yet, but George and Tim at GAMI have invited me to come see it, and have a little Oklahoma BBQ, too. There are rumors that it may even cure/prevent baldness, loss of memory, cancer, and the common cold!
Be careful up there!