


For pilots, no matter how clear the skies, we always seem to be dealing with the wind. So, let’s look at wind from the perspective of an aviation meteorologist—where it comes from, what goes into forecasting it, and even some tips to help keep your flying safer.
What Causes Wind?
Unless all your flying is at 7 a.m. in July, there’s usually wind to consider. For a better understanding, let’s drill down to the fundamentals to find the causes. Think of wind starting out as a large-scale force working in the background, but moderated at smaller and smaller scales by smaller, more potent, and more chaotic weather systems. At the smallest scales we deal with turbulence.
The root cause of wind is the unequal heating of the earth. We usually take it for granted that tropical areas are hot while polar areas are cold. But whether you’re in Greenland or Venezuela, the sunlight is the same. It’s the angle at which the sun’s rays hit the ground that makes the difference. Near the equator, the summer sun is at very high angles. But, in Greenland the summer sun never gets higher than about 30-40 degrees above the horizon, spreading the energy over a larger area, reducing heating of the ground and air.
Tropical Winds
With warm air in the tropics and cold air at the poles, we see a circulation where tropical air rises in the form of convective cells. This is centered mostly along the Intertropical Convergence Zone (ITCZ), which oscillates north and south from season to season and carries the tropical monsoon rains with it.
There’s a weak upper-level flow from the equator northward. Like an ocean current, it’s barely perceptible but the total momentum at work is staggering. As the Coriolis Effect takes hold, air turns toward the right by about 20 to 30 degrees north. With more air inbound, this results in air piling up in the upper levels, like a traffic jam made of air parcels. Conservation of mass means high pressure builds and a lot of the air is forced to sink to the ground.
This is how we get subtropical highs. Sinking air always means a stable atmosphere, fair weather, and warm conditions in the subtropical latitudes. This is why there are deserts in the Southwest U.S., Mexico, Australia, South Africa, and the Middle East, even though there’s plenty of ocean lurking just hundreds of miles away. Even though heating generates strong thermals each day, the atmosphere still prefers to sink. Underneath the subtropical high, the winds are often light, especially out over the ocean. This gives the familiar “doldrums” or “horse latitudes” that plague sailors.
Once back at the surface, some of this air flows back to the tropics, giving the familiar trade winds that dominate weather in the Caribbean. In the United States, even many southern states get some trade-wind action in August and September, when the mean flow becomes easterly. Airports like Atlanta Hartsfield switch to east flow and flights arriving from Texas have a headwind. This is usually because the large subtropical high has parked itself somewhere between Colorado and Virginia.
This pattern of upper winds flowing north to the subtropics, with the return flow of trade winds at the surface, gives what’s known as the Hadley cell. This is the primary driver of weather on the planet.
Polar Regions
The polar regions are marked by cold dense air, most of which hugs the ground. Like opening a refrigerator, this air doesn’t like staying in place but prefers spilling along the ground towards warm air. This is part of a belt of wind known as the polar easterlies. This is a bit of a misnomer as these winds aren’t always from the east, but they definitely go all out to spread southward.
Meanwhile some of the air from the subtropics flows northward, bringing the familiar warm southerly winds across the United States. These are the prevailing westerlies. At some point these winds converge with the cold polar air flowing southward. This collision area is where frontal systems develop, with the jet stream closely following. The air in these frontal systems tends to rise, producing unstable conditions, clouds, and precipitation.
All of this gives us two more cells—the polar cell and the Ferrel cell. The polar cell is centered between the poles at about 50 degrees latitude, with air sinking at the poles, flowing toward the equator, rising in the temperate latitudes, and returning poleward. The Ferrel cell is centered between 50 and 25 degrees latitude. Air sinks in the subtropics, flows poleward, rises, and returns southward. These cells are distinctly weaker and more irregular than the Hadley cell, but they do exist on the global scale.
And there you have the basics of global circulation. This kind of large-scale circulation is what gives us the prevailing wind at any given airport. Because of this we can assume in the summer that Hawaii and Florida will be under easterly trade winds, while Chicago will be under prevailing westerlies with the occasional incursion of polar winds.
Weather Systems
At medium scales, weather systems dominate the picture. These systems have a scale of about a thousand miles and a period of days, so we call them synoptic-scale systems. Most surface weather maps you see at a weather station are synoptic charts and they give us the day-to-day wind flow.
You probably remember from ground school that the difference in pressure across a specific distance gives us the pressure gradient. This can actually be depicted on a weather chart. If the isobars are at four-mb intervals and they’re spaced about 100 NM apart at the latitude of Chicago, the geostrophic wind equals 40 knots.
Of course the actual wind speed will be reduced 50 to 67 percent due to friction, but this illustrates the value of information we can get from pressure gradients. Up until the 1980s, weather charts often contained a geostrophic wind scale to help estimate wind speed. Some nautical sites and the U.K. Met Office still include them.
Mesoscale: In Between
At smaller scales, we deal with mesoscale weather systems. These have a scale of dozens to hundreds of miles, and a period measured in hours. Mesoscale systems are not handled very well by computer models. In fact it was only in 1993 with the introduction of the Eta model that weather service forecasters got regular access to such forecasts. We now use the WRF model which offers detailed subsets like the HRW and HRRR. The models usually get the larger systems right, but small-system predictions are little better than throwing darts. This is where your knowledge and wits really come in.
The most familiar example of a mesoscale system is the sea breeze, which invades coastal locations every morning and retreats at night. Another good example is the squall line, whose winds are driven by a large cold pool produced by falling precipitation.
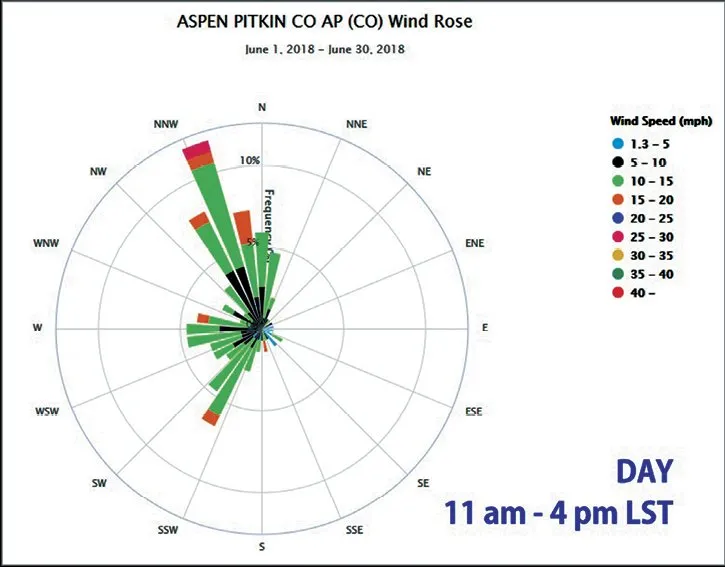
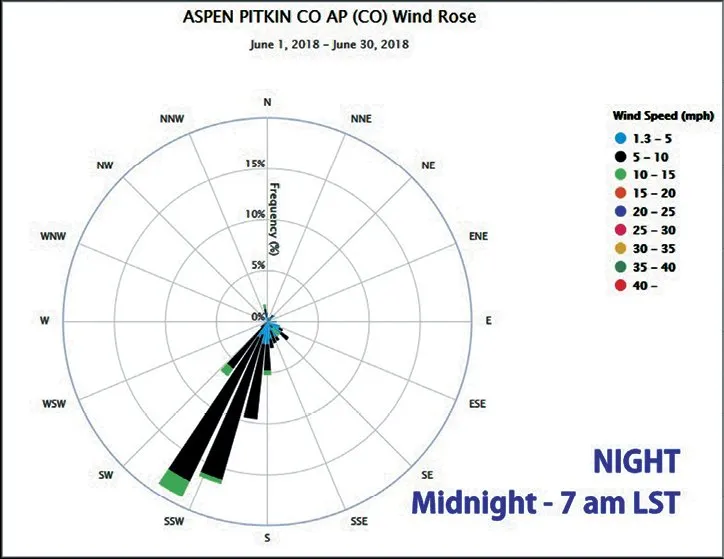
Mountain flying also falls in the mesoscale spectrum. The models still have trouble with this small scale, but by relating the airport location on a chart to the mountains and rivers, you can easily anticipate winds. Strong heating on mountain tops produces a circulation that flows up the valley and upslope during the day. Meanwhile at night strong cooling air on the slopes flows downslope and down the valley (sometimes called a drainage wind). These effects strongly influence the winds in mountainous areas during quiet weather conditions.
The illustrations below show one good example for Aspen, Colorado. But you don’t need to be in the Rockies. Nighttime drainage winds are very common in sloped river valleys, even in places like New York, Wisconsin, and Tennessee.
Individual thunderstorms are considered storm-scale weather systems, which are in a gray area at the bottom end of mesoscale. Only research models have any chance at this scale, but ATC and radar products can definitely keep you clear of this type of weather.
Microscale: Small But Tough
Finally there’s the microscale of about three miles or less and periods measured in seconds or minutes. Forecast models have no ability at all to predict microscale weather accurately and we might never see such predictions in our lifetime because of difficulties with physics packages and inadequate sampling. However forecasters and computer models are good at recognizing conditions that favor microscale systems and giving us a rough idea of the intensity.
Of course a classic example of a microscale system is the microburst. This is a compact downburst with a scale of 2.5 miles or less. The velocity gradients along microbursts are exceptionally strong and this is what makes them so dangerous. Larger downbursts can be dangerous too.
A more benign example is the thermal and the cumulus cloud. These are closely linked and you probably know them well. As you fly through them you’ll get a burst of positive rate of ascent, and if you’re above the freezing level in cloud, you’ll get some ice.
Tornadoes and dust devils, whose circulation occupies thousands to tens of meters respectively, are also microscale activities. You probably won’t be flying through tornadoes unless you have a lucrative reality TV deal, but dust devils commonly wander around airports, especially in the Western states, and often they aren’t visible. They produce wind spikes ranging from 20 to 50 knots, so during takeoffs and landings it’s worth a quick scan along the runway for suspicious dust plumes. The ideal dust devil location spot is in a zone of very intense solar heating along cloud shadows.
The smallest scales, what we call the gamma microscale range, measure tens of meters or less and mere seconds. These are mostly turbulence—eddies and vortices swirling through the flow and being converted to smaller scales. At the ground, this turbulent motion appears as wind gusts.
Both turbulence and gusts are closely related and occur in layers where the atmosphere is unstable or where shear is taking place, such as around obstacles. In the United States, a gust has an official definition: a difference between peaks and lulls of 10 knots or more, that ASOS stations will report as a gust.
Gust values are important to pilots, but the mere presence of a gust is valuable information telling you the atmosphere is unstable. Wind-flow disturbances due to obstacles and terrain will be magnified in such conditions. And since they’re all closely linked, you can assume that a layer with gusts will contain turbulence, and vice versa.
The Hazards
Naturally, the biggest hazards are at the microscale. These are the events that truly challenge your airmanship skills. Rising through larger scales we deal less and less with sudden hazards, and more with headaches that are rooted in operating limitations. Since these larger scales are captured well by computer models and forecasts, with proper planning they’re not much of a safety issue.
With gusty winds on takeoff or landing, the pros take half of the gust value and add it to their ref speed. For example, if you normally plan a Vref of 70 knots and the winds are 10 gusting 20, your new Vref would be 75. Smaller airplanes might consider reducing flap settings, but the higher speeds mean you’ll need to carefully watch runway length.
At larger scales, winds are more predictable. Crosswinds are mostly influenced by the pressure gradient at the mesoscale and synoptic scale. The main factor to be aware of is the crosswind component and your airplane’s maximum demonstrated component. This is the strongest crosswind that can be handled without exceptional skill. Typical values range from 12 knots for a Cessna 152 to 38 knots for a Boeing 777.
Yes, you can land in stronger winds, but when you’re getting to the limits of rudder or aileron authority it’s time to reject the landing and find a better runway. Of course, landing gear configuration, steering authority, main-gear width, etc. are all factors beyond your skill that determine the maximum crosswind in your bird. The NTSB reports are filled with GA accidents due to crosswinds.
At cruise, the wind direction typically shifts clockwise with increasing altitude—it veers with height. This gives us an interesting rule of thumb: when you’re at cruise altitude in fair weather and you have a steady wind hitting somewhere on your starboard side, you can often decrease the headwind component or get a tailwind by climbing. The exception is in strong cold advection patterns, such as behind a cold front. These situations are less common, but when they happen the winds will tend to change counterclockwise with height, giving you the opposite result if you climb.
That completes our review of winds. If you want to learn more about wind patterns at your favorite airport and explore the hour-to-hour or month-to-month variations, there’s a site just for you. You can plot graphs just like the one for Aspen, Colorado for all different ranges of dates and times. Visit the Midwestern Regional Climate Center to get started. Stay safe out there.
This article originally appeared in the August 2019 issue of IFR magazine.
For more great content like this, subscribe to IFR!

Thank you for the detailed descriptions Tim. As a new pilot, these discussions are helpful but, could really use some more graphics to help visual learners. Going back to the top to re-read…