


Dialing in the altimeter setting is perhaps one of the most universal, timeless rituals of aviation, spanning decades, continents, and cultures, and tying all pilots to one another. This underscores the importance of atmospheric pressure and its effect on flight safety. But how much do you know about where those numbers come from?
In this article, we’ll take an introductory look at barometers, pressure, and get a better look at where QNH, QFE, and other values come from. If you’ve found them mysterious or confusing, this article is for you.
The Basics Of Pressure
The atmosphere is made up of a large volume of gas, consisting of nitrogen, oxygen, argon, and a number of trace elements. We often slip into the mindset of thinking that the air floats freely
and has no weight. Even in the 17th century such a thing seemed obvious to the Italian scientist Galileo.
He and another scientist, Giovanni Battista Baliani, were puzzling over a problem that frustrated civil engineers in the 1630s: why do vacuum-powered water siphons fail to bring water upward from wells when the vertical rise exceeds 30 feet? Galileo drew attention to the mysteries of the vacuum. He suggested that although a vacuum had some sort of innate ability to pull water upward, its power was clearly limited.
But a decade later, a student of Galileo, Evangelista Torricelli, framed the problem differently. He proposed that the energy put into the system comes from the weight of the air pressing the water from behind, pushing the water into the vacuum where there is no resistance.
It was immediately evident that the tall evacuated tubes of water in which these experiments were performed measured the atmosphere’s pressure. They served as the first barometer. On Galileo’s advice, Torricelli instead began using the much denser substance mercury to measure the pressure, and it required a tube only three feet high instead of a massive, awkward outdoor apparatus.
In general, pressure is expressed either in inches of mercury, or in millibars, an SI (Système International) system of units. Forecasters know the two constants of normal sea level barometric pressure: 29.92 inches of mercury, or 1013.2 millibars. Sometimes pressure is expressed in millimeters of mercury, or mm, but we almost never encounter this in forecasting or aviation.
Furthermore, pressure expressions we’re all familiar with use mean sea level (MSL) as a common reference level. Whether you receive an altimeter setting at Miami or Denver, both expressions use a reference based at sea level, and the same ranges of numbers tend to have similar meanings at both stations.
Pressure Reduction
In a simple model of the world, all land would be perfectly flat. Weather stations would be at the same altitude, making it easy to compare the readings with one another. Using a common reference level makes things extremely easy. There’s only one kind of measurement, everyone knows what it is, and it’s clear how to use the information.
But nothing is ever simple. A quick scan of my database of official weather stations worldwide shows that elevations range from 1266 feet below sea level at Bar Yehuda Airfield in Israel, to 17,319 feet above sea level in Naser, China. When you obtain a pressure reading at Naser, over three miles above sea level, how do you convert it so that it can be compared with the pressure at Beijing International Airport? Unfortunately the problem is not so simple. And for forecasters these variations between different elevations can change the pressure value by 50 percent, whereas in most day-to-day weather systems the pressure varies only by 0.5 to 1 percent. If we don’t compensate for elevation properly, the pressure data becomes useless for forecasting.
It’s true that pressure is dependent on the makeup of atmospheric molecules and their constituent elements. In that respect, its properties are fairly constant. But it’s also dependent on the density of these substances, which in turn is defined by the temperature and moisture. These vary immensely from place to place, and from day to day. And it’s not enough to simply know the density at one level. The changes in density throughout the entire vertical column above a station must be known.
These problems emerge when the station is above the common reference level, in other words, when the station is above sea level. This poses the question of how you estimate the pressure that exists underground? This is the complex problem known as pressure reduction.
Station Pressure (QFE)
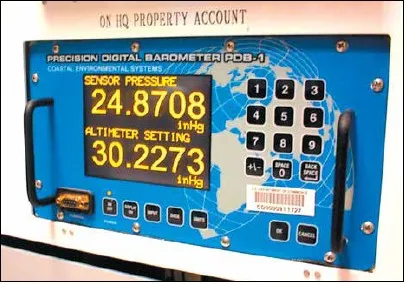
Let’s start out with the most basic, elemental pressure reading: what a mercury barometer would read. This is the actual observed pressure. It’s entirely a function of the air pressing on the column, and will range from about 30 inches of mercury at sea level to 15 inches at the mountaintop station in China we mentioned above.
This raw, uncorrected expression of pressure is known to meteorologists as station pressure or sensor pressure. Pilots will almost never encounter this reading, but weather observers are quite familiar with it. At the stations where I worked, all of our backup aneroid barometers, like the precision ML-102, were calibrated to show this number. It was the raw value from which all pressure calculations flowed.
This pressure expression is also known as QFE. If you could dial it into your altimeter, it will display your altitude relative to the runway. Chances are you won’t encounter QFE outside of aerobatics events and routine operations in the former Communist bloc countries. If you do encounter it be aware that the value is applicable strictly for the airfield that reports the value, and it can’t be used elsewhere.

Incidentally, perhaps you’ve seen these pressure expressions “QFE” or “QNH” and wondered what they mean. It’s simply an arbitrary radiotelegraph code known as Q-code, developed in the early 20th century to expedite pieces of information using Morse Code. You can imagine how long it would take for the radio operator on a Boeing 377 Clipper to tap out every letter of “please provide us the sea level pressure.”
Altimeter Setting (QNH)
Station pressure uses the altitude of the weather station as a reference level. But in forecasting and aviation we want a sea-level reference. Now we’re back to that problem: how do we figure out the barometric pressure underground? Maybe we can drill a hole to sea level. Well, no; that would cost a fortune and it would introduce bias from the warm temperature of the rock.
A simple and physically sound approach we can take is to develop a typical density profile for the entire atmosphere at all altitudes and apply that to our problem. Perhaps the most familiar profile is the International Standard Atmosphere (ISA). Using the ISA properties, we can use the density within this model of the atmosphere to extrapolate downward to figure out what the pressure should be at sea level. The formula for this is fairly simple and can be done on a calculator.
This extrapolation gives us a quantity known as altimeter setting (ALSTG), also known as QNH. Altimeter setting is expressed in inches of mercury. From the 1950s to the 1990s the altimeter setting from various airports, along with its hourly change of state, were widely distributed on the FAA 604 teletype circuit and on NOAA Weather Wire, and this made it a staple of the TV weather report. When you hear about the “barometric pressure” at the airport on the TV, you’re getting the altimeter setting.
And in a METAR report, altimeter setting is given in full hundreds of inches following the letter “A”, just after the temperature and dewpoint. For example, a pressure of 29.84 inches is printed as “A2984.”
Below 18,000 feet, United States ATC facilities use QNH of a local airport as the reference pressure. When your altimeter is set to QNH while parked on the ramp, your altitude will match that of the airport. If you fly away from that airport, errors will creep in due to variations in the pressure gradient. At 100 miles away this error can amount to tens or in some cases hundreds of feet, and the pressure can change from hour to hour, so it’s essential that you’re regularly getting QNH updates when in the soup at low altitudes.
Finally, QNH is a noteworthy source of error. We’re accustomed to readings in the 29.50 to 30.50-inch band, but sometimes the values sneak down to lower ranges. I worked one stormy January day at the Tonopah Test Range in Nevada when a contract 727 inbound called us for the conditions. I read him the pressure, 28.96 inches. The pilot copied it as 29.96 inches, and the error was caught when I requested the readback.
If the error was not caught, his altimeter would have read 1000 feet high. Given that we had a low ceiling and mountains, that story could have ended in an entirely different and tragic way. Always double check your altimeter setting when the weather is bad. The units and tens digits are critical and can catch everyone off guard, including controllers, when workload is high.
Sea Level Pressure (QFF)
Altimeter setting is not ideal for synoptic (national or continental scale) forecasting because temperature fluctuations, diurnal oscillations, terrain, and climatology can bias the results. To overcome this, weather services in the early 20th century developed a different expression of pressure simply known as sea level pressure (SLP), which is by convention expressed in millibars (or hPa, hectopascals, the same thing). Obviously this can be a source of confusion because altimeter setting is given using a sea level reference, but one way to differentiate the two is ALSTG is in inches, and SLP is in millibars.
In a METAR report, sea level pressure is found in the remarks following “SLP.” It is given in millibars with the thousands and hundreds place omitted. For example if the pressure is 1034.8 mb, we will see “SLP348.”
Like altimeter setting, sea level pressure attempts to reference the pressure to sea level, but it uses much more sophisticated and sometimes esoteric methods to reach a result. The station’s temperature history over the past 12 hours needs to be included, and reduction tables are complex. At most stations in the western half of the United States, they’re developed by a special National Weather Service team. The complexity of developing reduction tables is one reason why some stations do not report sea level pressure. And as you may have guessed from all this, altimeter setting and sea level pressure are not at all the same thing, though they will usually be close to each other.
From a forecasting standpoint, all weather maps are built from sea level pressure. Starting in the 1980s as the science of mesoscale meteorology and severe convective weather emerged, some analysts and researchers began suggesting that forecasters use altimeter setting to build small-scale weather maps to remove the filtering and corrections that go into sea level pressure values and help expose important, small scale changes in the data. I agree with this and often build maps with altimeter setting on a severe weather day.
Pressure Altitude (QNE)
Finally, there’s pressure altitude, also known as QNE. If you’re parked on the ramp with your altimeter set to 29.92, it will read pressure altitude. It will read, on average several hundred feet high when there’s low pressure, and several hundred feet low when there’s high pressure. Correct it with temperature data and you get density altitude, which has a big influence on your aircraft’s takeoff and landing runs.
In the U.S., QNE is also used as the pressure reference for aircraft above 18,000 feet. Altimeters will not show the true altitude above sea level, but it puts everybody on a common reference level that ensures separation. The reference level will rise and fall from place to place depending on the weather, but everyone rises and falls together.
Unusual Weather Conditions
If QNH is available for your destination airfield, you can be assured that your altimeter will be correct when your wheels touch the runway. But for aircraft in the air, there are some peculiarities that emerge when there is a low pressure system or there is a cold air mass in place. The first creates abnormally low pressure; the second creates a stronger vertical pressure gradient. Both of these situations will cause altimeters in flight to read artificially high and put pilots in danger.
These situations can occur in Alaska, Canada, or the Rockies during the winter, especially when cold inversions set in, and this can cause an unexpected flight into terrain or obstacles. Be aware of when you need to use those coldtemperature altitude correction charts, and be especially attentive to CRM and correct procedures when there’s deep low pressure or a very cold air mass in place. Official airfield directories and approach charts tell you where and what to adjust.
This article originally appeared in the February 2021 issue of IFR magazine.
For more great content like this, subscribe to IFR!

I particularly liked the brief history of how atmospheric pressure was scientifically elucidated.
As a student of the history of science, and the geographic exploration of the African continent, the centuries-old quest to find the source of the Nile river is a great tale. How is this related to atmospheric pressure you may ask?
Spoiler alert! if you are unaware of who Burton and Speke were, go to these links first.
https://www.theguardian.com/books/2011/sep/11/burton-speke-african-exploration-nile
https://www.youtube.com/watch?v=JnFxh0O_8Q0
Anyway, in the early days (before aviation arrived!) the accepted technique for determining the altitude AMSL at any location was the simple process of boiling thermometers, and extrapolating the indicated temperatures.
So to cut the long story short, these two gentlemen set out as a team to discover the answer to an enigmatic question that had haunted all the great ancient civilisations for many thousands of years. Water flows downhill. So if you are unsure of the connectiveness of multitudes of waterbodies in a watery maze, altitude solves at least one unknown – which one is higher?
Equipped with dozens of specially made glass mercury thermometers, they set out.
And after a few years of walking around Africa, and breakages en route, they were down to their last one. And they had a disagreement about where to go next. So who took the thermometer?
What a story! But it didn’t end there.
After years of living in the wilds, and feeding their teams of porters (30-40 men by some accounts) by hunting big wild game in Africa, they returned to England. And at a conference where they were to deliver the results of their odyssey and announce they had discovered the Source of the Nile River, as entertainment, a pheasant shoot was organised. Typical pastimes of English gentlemen.
And one of them got shot by his own gun “by accident” !!!
Hard to believe such a prolific hunter, used to living by firearms for years, could have made such a rookie mistake. The conspiracy theories have abounded ever since.
Tim Vasquez writes: “Chances are you won’t encounter QFE outside of aerobatics events and routine operations in the former Communist bloc countries.”
That statement could be expanded a little! In UK, QFE is routinely used for circuit operations. We can get away with this because we don’t have any really high-altitude airfields.
in friendship
Rowland
Also used in glider training and local flights.
I did the majority of my flight training in Illinois. Then while on vacation I decided to rent a 172 in Florida and do a little site seeing and practicing. As I was setting up everything, I dialed in the altimeter. It read zero. At first I thought it was broken. Then I remembered that Florida is at sea level. It was reading correctly. Quite the lesson plan that day.
Very informative, enjoyable article!
What, no mention at all of that great window-inventor Paul Kollsman?