Heading into another winter season, our thoughts begin shifting to cold-weather flying hazards—fog, icing, and widespread precipitation. Most pilot training considers each of these factors individually. But most of them share a common cause, and it’s rooted in the weather patterns. Because of that, most pilots will be ahead of the game if they can identify some of those underlying factors. This article is designed to give experienced pilots a taste of the technical side of weather, so you can better understand how weather briefers think while gaining insight into complex aviation weather problems.
Vertical Motion
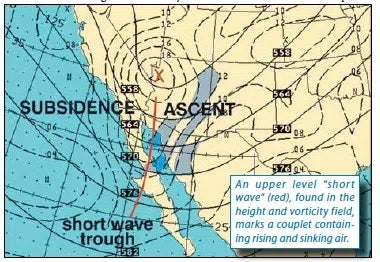
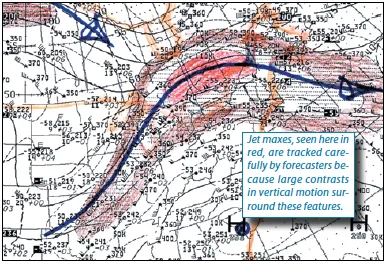
In meteorology, rising motion in the atmosphere is described as lift or ascent. Descending motion is referred to as subsidence. This motion is on the scale of centimeters per second with frontal weather systems, rising to many meters per second in thunderstorms. Unfortunately most of this lift is very subtle, and there’s no way to measure it with instruments. Even forecast models have a difficult time solving vertical-velocity calculations, since the equations use large magnitudes that normally cancel each other out. Because of this, forecast model output of vertical motion inherently contains a lot of mathematical noise. So forecasters rely on other tools like vorticity, advection, divergence, and Q-vectors to better estimate this motion.
Lift tends to produce clouds and bad weather, while subsidence can clear things out and improve the weather. This is because subsidence causes compressional warming and lowers the relative humidity. Ascent causes parcels to cool, the reverse of compressional warming, and increases the humidity. There are a few factors that have paradoxical effects: most notably stable inversions that trap fog and haze, and unstable air masses that churn the air and clear this stuff out, yielding excellent visibility. Sometimes unexpected effects are due to combinations of stability and instability at different levels (We solve this with a Skew-T diagram.), but the basics still apply at each level.
There are two fundamental types of motion we see in the atmosphere. Convection is the result of direct heating and cooling, much like the buoyancy currents that develop in a kettle when the base is heated by the stove. The sun is the most prominent source of heating, but an air mass sitting over a warm ocean or landmass can also obtain heat through conduction. Radiation into space and soaking of heat by cool landmasses are common sources of cooling. Vertical density contrasts redistribute hot and cool spots vertically through buoyancy, perhaps knocking your Mooney around as they do so.
The other type of lift we lump into a category variously called forcing. This is sometimes called dynamic lift or dynamic subsidence. Radiation, conduction, and buoyancy are not necessarily involved. Ascent and subsidence comes from mass imbalances resulting from accelerations and forces working on the air. Forcing may also have mechanical causes, such as flow over sloped terrain and friction.
Instability
Instability converts potential energy into kinetic vertical energy whenever layers of cold air overlie layers of warm air. This creates buoyancy as the air tries to restore equilibrium. A rising thermal is produced, and we see compensating subsidence around the edge of the cells, giving us the well-known rollercoaster ride encountered by gliders. A cold atmosphere and strong solar heating from below proves great weather for glider pilots.
Instability most often comes from solar heating, which conducts heat from the ground to the base of an air mass and starts the process of thermals that ascend into the atmosphere. However it also can come from cold air overlying relatively warm ground, which heats the bottom of the air mass. We can also get it from differential advection, where wind is transporting warm air from one region in the lower levels and cold air from another region in the upper levels. This is one reason directional shear goes hand-in-hand with stability changes.
The reverse is true for stability: a trend towards warm air overlying cool air. This can come from radiational cooling at night, from warm air moving over colder ground, or from the release of latent heat into the upper atmosphere by thunderstorms. Differential advection can also stabilize the air.
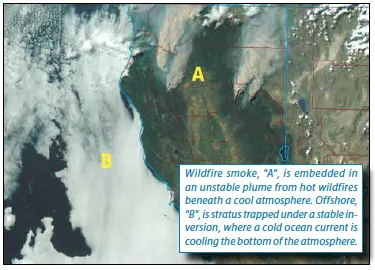
A stable air mass suppresses vertical motion and minimizes wind gusts. Unstable air encourages increasing vertical motion through churning of the air mass as it tries to reduce the temperature contrasts. Wind gusts, as you might see in METAR observations, are an important red flag that suggests an unstable layer exists, at least in the lower atmosphere. By considering the various root causes of instability, you can guess which process might be at work. Gusty north winds in Milwaukee in March with a north wind suggests cold air moving over warm ground, for example, and that’s valuable information that shapes the rest of the TAF.
Phase Changes
Let’s review phase changes, because sooner or later this process leaves its mark on any sort of vertical motion, whether it is from convection or forcing. So it’s important to be familiar with it. Good news: we’ll keep things simple and avoid the heavy lifting, and focus only on the concepts you need to know.
Water has three primary phases: solid (ice), liquid (water), and gas (vapor). You might think of ice as something that only exists below zero degrees C and vapor as existing only above 100 degrees C, but this is not entirely true. What we consider moisture and humidity at room temperature is water existing in vapor form. This is possible because of processes that occur at the molecular level. The total amount of water vapor that can exist in the air is controlled by temperature. This is a big reason why it’s a lot easier to get heavy rain and flash flooding in summer than it is during cold rain episodes in winter.
The dewpoint temperature can be thought of as a measure of the amount of water vapor that the air contains so far. Meteorologists prefer to use mixing ratio or vapor pressure instead of dewpoint when they want to be scientifically precise, but dewpoint is easy to understand and works fairly well for general forecasting. Now you’re getting an idea what the dewpoint on the ATIS broadcast is good for.
When water changes from a higher to a lower energy state, such as vapor to liquid, or liquid to ice, we call this condensation or fusion/freezing. This releases latent heat into the surrounding air. But when we ascend to a higher energy state, such as ice to liquid or liquid to vapor, called melting and evaporation, latent heat is absorbed. Now you know why you get cold getting out of the swimming pool. In Phoenix and Las Vegas, the air has lots of room for additional vapor due to the high temperature and low dewpoint, so lots of evaporation takes place and the chilling effect is even stronger.
These types of heating and cooling are called adiabatic by forecasters, because the heating and cooling take place internally within the air, without heat going in or out. Adiabatic heating contributes enormously to the buoyancy within thunderstorms, tropical cyclones, and even powerful Nor’easters along the Atlantic coast. Adiabatic heating through a deep enough layer in the atmosphere even lowers surface pressure, while adiabatic cooling increases it. But this contribution to bad weather shrinks or grows the weather system, providing an indirect effect to bad weather—a sort of slow burn. Most of the fast-changing effects we see in forecasting occur quickly and directly.
Orographic Effects
When air flows up the side of a mountain, the terrain forces air to rise. The result is orographic lift. When there is humidity in the air, we see cumulus clouds forming on the mountains and growing into showers and thunderstorms. So it can be said that the storms developed from orographic forcing.
There’s also upslope and downslope flow, which doesn’t involve mountains but sloped terrain over a wide area, such as the increase from 1000 feet MSL in eastern Kansas to 3500 feet in western Kansas. This is exactly the same as air flowing up a 3500-foot mountain, but over a longer time and space scale. With enough moisture the end result is the same: showers and storms, but the larger horizontal extent favors development of broken-to-overcast stratus and stratocumulus. In exceptionally humid situations, fog and drizzle can develop. When persistent winds are out of the east on the Great Plains or anywhere with sloping terrain, be on the lookout for deteriorating conditions, especially if the temperature-dewpoint spread is less than several degrees Fahrenheit.
Mass Continuity
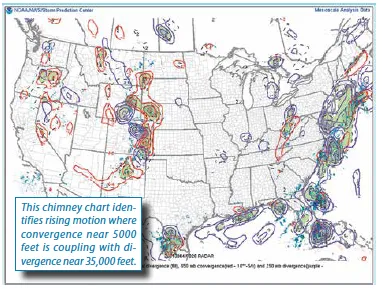
What happens when the air in the upper troposphere spreads apart, or diverges, forming a void? According to the principle of mass continuity, mass must rise from below to fill the void. Air must then converge in the lower levels. Likewise when air converges in the lower levels, such as in a low pressure area or along a front, air must rise. Both of these situations tend to produce clouds and rising motion. This is one of the main reasons we see lines of showers along frontal boundaries and in pressure troughs.
Likewise, surface divergence is associated with low-level divergence. Air from above must sink to fill the void. Upper level convergence can help intensify this sinking motion. This is a major reason why Portland, Oregon, reached 116 degrees and British Columbia saw 121 degrees a few months ago. Strong sinking of mid-level air dramatically increased compressional heating of the air mass, producing warmth through an adiabatic process.
Isentropic Lift
As a pilot you’re aware that temperature falls with increasing altitude. However these spot readings don’t tell us much without knowing the exact altitude. Meteorologists deal with this problem by using potential temperature, sometimes called theta. This measures what the temperature would be if we forced the sample of air vertically to the 1000 mb (29.53 inches Hg) level, allowing it to warm through natural compressional heating, and measured the temperature there. In a standard atmosphere, the 1000 mb level is close to sea level.
In effect, this gives us a normalized temperature reading, allowing us to compare values from many different levels. It’s a fantastic tool for cross sections, because stable layers stand out showing packing of theta contours in the vertical, and unstable layers show these lines spread far apart. It’s even useful in regular forecast charts: theta lines behave like isotherms, but aren’t distorted much by elevation differences in hilly terrain.
Potential temperature always increases with height. In fact, at jet cruise altitudes, potential temperature is often 60 degrees C or higher. It comes as no surprise that bleed air on a large Boeing jet is hot once it’s pressurized, requiring it to pass through AC packs before we can circulate it into the cabin. This is because its pressure was raised well over halfway toward its 1000 mb potential temperature.
In meteorology we like to view potential temperatures as surfaces, like massive blankets that stack up to the stratosphere. Where air masses are cold, it’s like an object under the blankets that bumps that area to higher altitudes (that bump is the colder theta temperature blankets we had to pack in there). In hot regions, the lowest blankets sag downward, bringing the hotter theta blankets close to the ground.
Air conserves its potential temperature, meaning it prefers to cling to specific layers within blankets, as if they were trapped between the sheets. It takes external heating or cooling to change layers with interesting implications around frontal systems.
Take a warm front, for example. On the cold side of the front, these blankets are bumped to higher altitudes by the cold air mass, meaning when air flows from warm to cold across the warm front, it’s forced to rise as it climbs over the bump. The result is isentropic lift. If some unusual process reverses the wind across the front, the air descends instead and we get isentropic subsidence and clearing along the front.
The takeaway from this is you can often look at a weather map with temperature plots to guess what’s happening. Where low-level winds are blowing from warm to cold regions, expect deteriorating weather, especially in the presence of high relative humidity. This is common in warm frontal zones and northeast of surface cyclones. This rule of thumb works only for relatively quiet weather patterns and does not hold up during active weather, such as when diabatic processes are dominating the weather (strong air mass modification, strong heating, etc.) or once widespread precipitation has developed.
Now What?
Now you’ve had a taste of some of the factors forecasters look at when assessing a region for IMC, for precipitation, and overall cloudiness in general. You too can use these principles when reviewing weather charts. While you might feel you don’t have the skill to forecast on a day-to-day basis, the concepts presented here might help fill in some of the detail when you compare a TAF to the observed weather. The result is greater awareness of the weather patterns and a better understanding of how it’s all put together. That’s situational awareness, and it’s where training, procedures, and knowledge combine with observation and intuition to ensure a safe flight.
This article originally appeared in the November 2021 issue of IFR magazine.
For more great content like this, subscribe to IFR!